The Beginner’s Guide to Using Shopify Reports and Analytics

Imagine this:
You’ve put together your Shopify store and sale numbers are also growing just as they should.
But now when you want to scale your business further, you require data on your customers, bestsellers, sale channel performance, and more. Shopify surely has a great tool for it—named Shopify Analytics—but you don’t have enough knowledge on how to utilize it.
Yes, its analytics provide you with a sheer number of reports that help you understand how your business is performing in overall, which is great.
However, not understanding its use cases might overwhelm you.
Don’t worry. We’re here with the help. ⛳
In this guide, you’ll understand how to use Shopify analytics and reports in the right way that helps you make better decisions for your online business.
Let’s start with understanding its importance.
Why Are Shopify Reports Vital for Your Business?
Source – Shopify
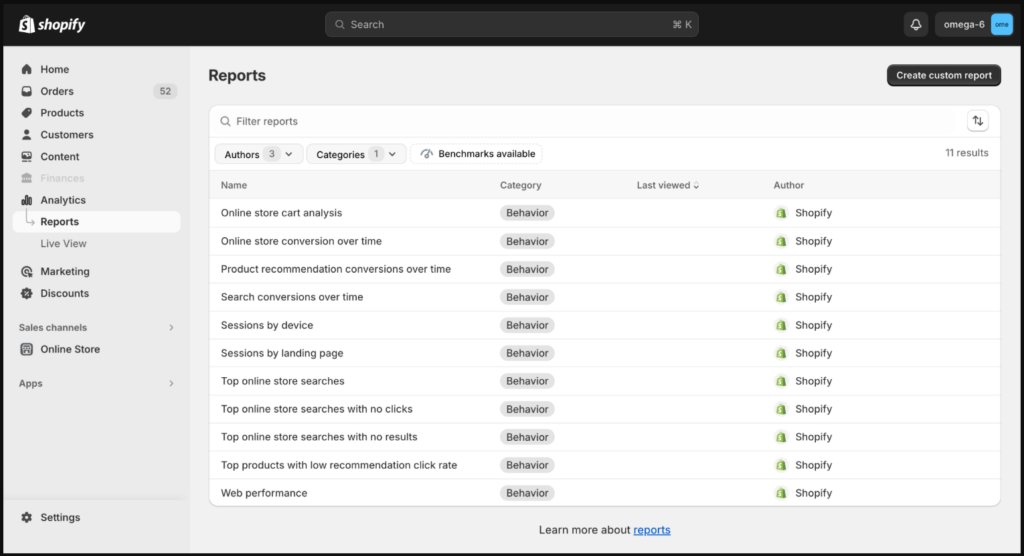
Shopify reports are crucial to understanding your business’s performance. They provide a clear picture of your store’s sales trends, customer behavior, and inventory levels, allowing you to generate insights and make informed decisions that drive your store’s growth.
Shopify reports enable you to track your store’s key performance indicators (KPIs) and see what’s working and what’s not. The insights from the reports also help you with planning. You can optimize inventory and marketing strategies based on where demand is highest for better sales.
Shopify reports also improve data organization and make data retrieval and visualization more efficient.
By smartly using Shopify reports, you can understand what works for your audience and market, helping you respond to positive sentiments to stay competitive.
;
Now that you know why Shopify reports are integral to your business, let’s understand where you can find them in your store.
Where to Find Shopify Reports on Your Store?
Finding Shopify reports on your store is relatively easy. Here’s how you can do it.
- Log in to your Shopify store.
- Go to Analytics from your Admin panel.
- Click Reports.
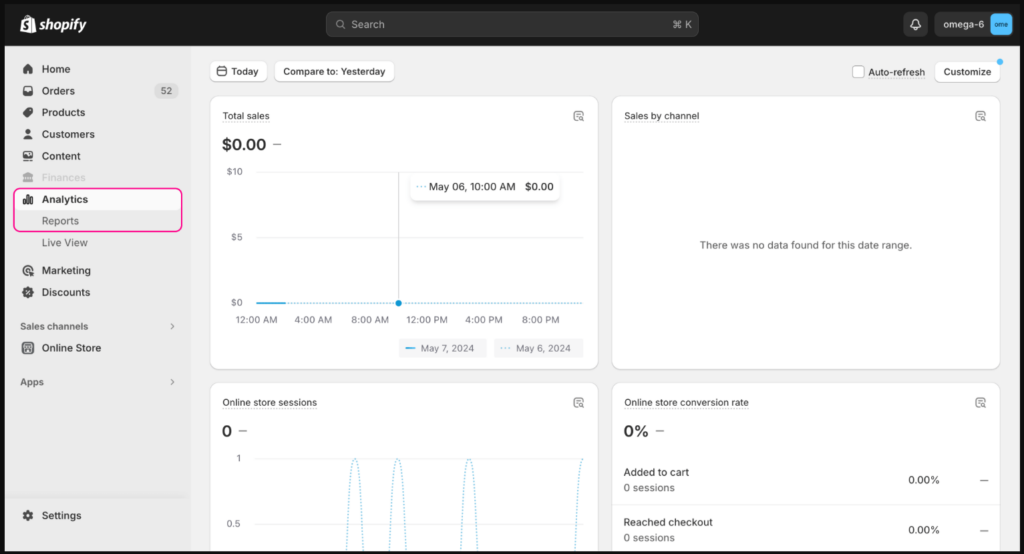
Source – Shopify
There, you have the reports for your Shopify store.
There’s one element of vital importance you need to consider – Not all reports are available with all Shopify plans. This means that if you are using plans like Shopify Lite, Basic, or advanced plan, the number of reports you can generate on your store also changes.
Here I’ve attached an image showing the reports available with different plans offered by Shopify.
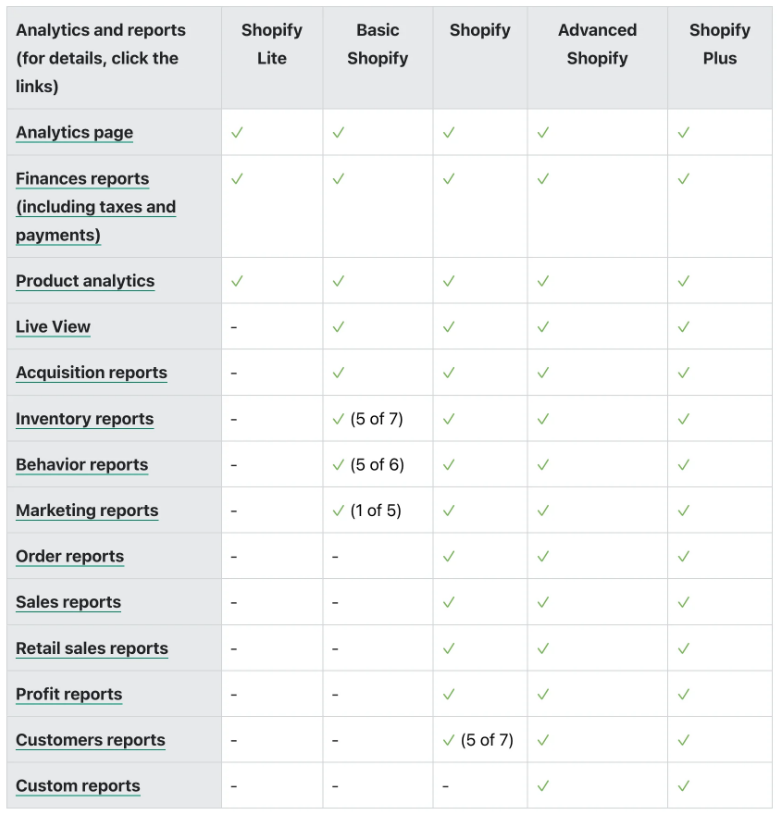
Source – Shopify
This will show you all the reports that the Shopify store offers.
But are all these reports relevant to you, or should you use them all? Not really.
That’s why we are going to discuss only the most essential Shopify reports in the next section. Let’s get to it.
Most Important Shopify Reports You Should Consider
Although Shopify has numerous reports you can use, not all businesses may use them. Let’s check some of the essential Shopify reports available in your store.
1. Shopify Acquisition Reports
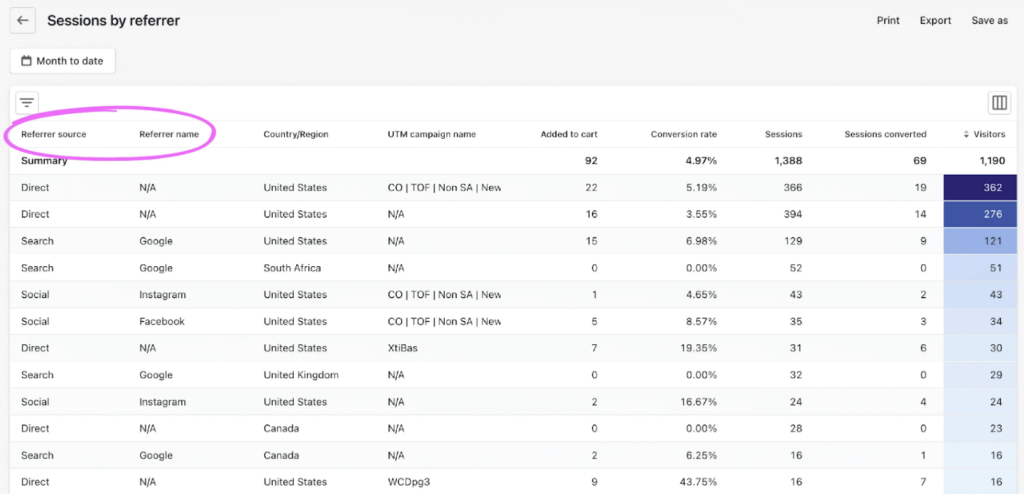
Shopify acquisition reports tell you how your customers come to your store.
The data helps you understand where your customers are coming from—organic traffic, paid ads, and social media—and what encourages them to visit your store. Remember that the acquisition reports do not show details like conversion or sales. They only display the visitors to your site.
Source – Shopify
The report contains three important metrics that you need to understand to use effectively to grow your business.
- Sessions over time: This shows you the number of visitors and their sessions for your store for the selected time range.
- Sessions by referrer: This metric allows you to track visitors and their sessions from a particular source, such as Instagram, TikTok, affiliate links, etc.
- Sessions by location: This report enables you to discover the location of the visitors, such as countries, regions, etc., who are accessing your store online.
Acquisition reports in Shopify can help your business immensely. Here are a few key advantages of using them for decision-making.
- Acquisition reports can help you determine the source of your visitors. These insights allow you to allocate marketing resources to high-performing channels.
- They let you analyze visitor data and tailor your ad campaigns to target specific locations or customer cohorts.
- Acquisition reports help you understand visitor behavior. Based on the behavior data, you can refine your website layout and product offerings.
- These reports allow you to track visitor behavior trends over specific periods and optimize your campaigns based on the same.
2. Shopify Behavior Reports
Understanding how visitors behave on your site is crucial to your store’s success.
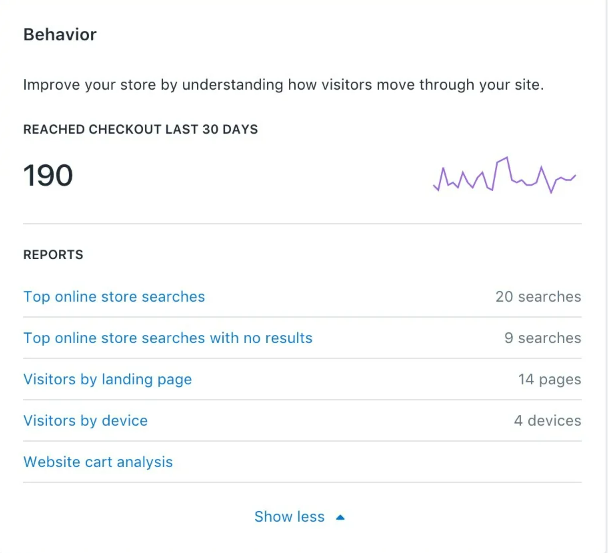
Shopify’s behavior reports help you do just that. When you know how visitors interact with your store and what actions they take, you can improve your store accordingly for better engagement, conversions, and revenue.
Source – Shopify
Behavior reports also enable you to understand what products your visitors search for the most, how they navigate through your store, and where they leave your store.
You can generate several reports within the behavior reports to get granular data. Here are a few of the most crucial ones.
- Sessions by device: This shows the devices that your visitors commonly use to access your Shopify store.
- Sessions by landing page: This metric helps you understand the pages that your visitors land on when they first visit your store.
- Product recommendation conversion: This tells you how many of your recommended products convert.
- Cart analysis: This report helps you understand which products customers add to their carts the most and buy.
- Top online store searches: This metric helps you discover the terms that your visitors use to find products and product pages.
- Store conversion: This shows the number of visitors who make a purchase after visiting your store in a given time period.
Shopify behavior reports can help you learn a lot about your customers. Here are a few key benefits of using them.
- Behavior reports track how visitor conversions change over time. This helps you assess the impact of website tweaks and marketing strategies.
- These reports help analyze your store’s performance to identify areas for improvement to ensure a better shopping experience.
- They reveal how well your product recommendations convert and help you refine your upsell and bundling strategies.
- Top store search insights from behavior reports help you discover customer interests and gaps in product offerings to improve inventory management.
- Behavior reports help you assess sessions by device and landing page, enabling you to tweak your store to cater to the needs of different user cohorts.
3. Shopify Finances Reports
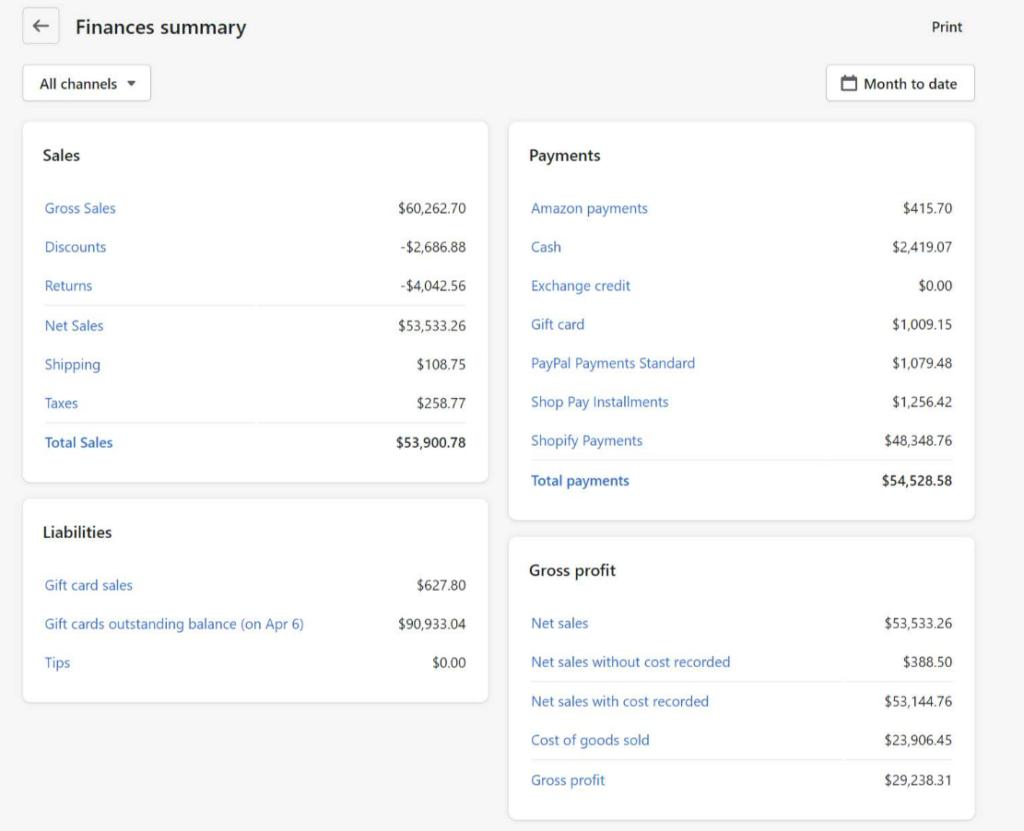
To determine your business’s success, you need financial details, such as total revenue, expenses, taxes, profit, etc. Getting these reports monthly, quarterly, and annually helps you understand your business’s financial position.
Source – Report Pundit
These reports also help you understand whether your financial fundamentals are strong or whether you are losing revenue due to unwise strategies. You can gain overall insights into where money is coming from and where it is going.
You can explore different metrics within the reports, such as the ones below, for further insights and details.
- Gross sales: This report shows the total revenue generated by your store for the selected period before deductions.
- Discounts: Here, you can find the total discounts you have offered on sales of your products for the selected period.
- Refunds: This report displays the total amount you have returned to customers after making sales for various reasons.
- Shipping: This metric shows you the overall cost of product shipment for the period selected.
- Tax reports: This shows the overall taxes you have charged on the sales made in your store, including the taxes for the state and the country.
The advantages of Shopify finance reports are numerous. They help you track one of the most important elements of running a business: finance.
Here are a few benefits of using these reports.
- These reports help you track your current sales, expenses, and cash flow data and make decisions based on them.
- These reports help you make better budgeting decisions and spend resources more effectively.
- Shopify finance reports allow you to track tax obligations for compliance and timely tax payments.
- The profit reports let you assess the profitability of products and sales strategies to improve them if needed.
- Historical financial data helps you identify sales and expense trends and tweak strategies for better future results.
4. Shopify Inventory Reports
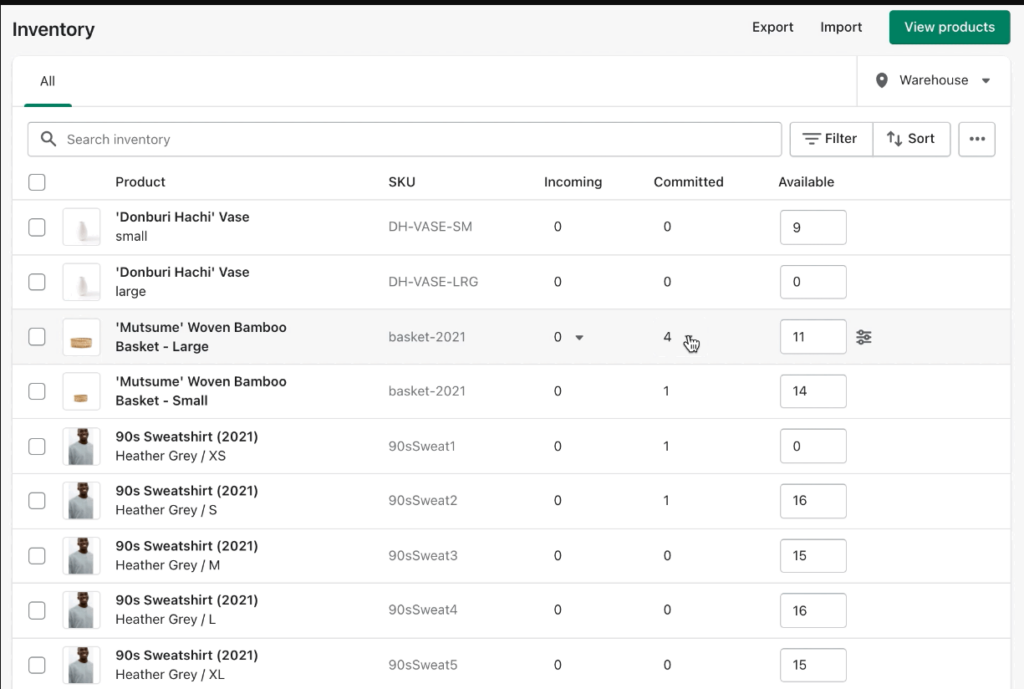
The inventory reports show you a snapshot of your inventory at the end of the month.
You can also track the number and percentage of the inventory sold per day with the help of the reports. The reports also bring historical inventory data, meaning the inventory details of deleted products are available in the report.
Source – Shopify
Since inventory is at the heart of your store, the report can help you gain deeper insights into product performance and evaluate your inventory strategy. Here are a few metrics available within inventory reports to acquire more details on your store’s inventory.
- ABC analysis by product: This report attributes a grade (A, B, or C) to each product variant based on its percentage contribution to the store’s overall revenue within the last 28 days.
- Product sell-through rate: This metric provides the percentage of your total inventory that you sold during the selected period.
- Days of inventory remaining: This report explains the number of days the current inventory will last based on its historical sales data for the selected period.
- Month-end inventory snapshot: Here, you can find the quantity of each product variant remaining in your inventory at the end of the month.
- Average inventory sold per day: This report shows you the average number of products sold for each product variant every day within the chosen period.
Shopify inventory reports offer you extensive insights that can help optimize your inventory. Here are some of the key benefits of using inventory reports for your Shopify store.
- Inventory reports help you identify bestselling products, and these trends allow you to make better decisions about restocking and promotions.
- These reports help optimize inventory to avoid stockouts and overstock with better demand forecasting.
- These reports offer unique insights with ABC analysis and sell-through rates. Based on these insights, you can reassess the marketing strategies to focus on high-performing products.
- Inventory reports show you slow-moving or dead stock. By optimizing inventory, you can reduce losses due to unsold inventory.
- Optimal stock levels based on inventory insights reduce stockouts and improve customer experience.
5. Shopify Marketing Reports
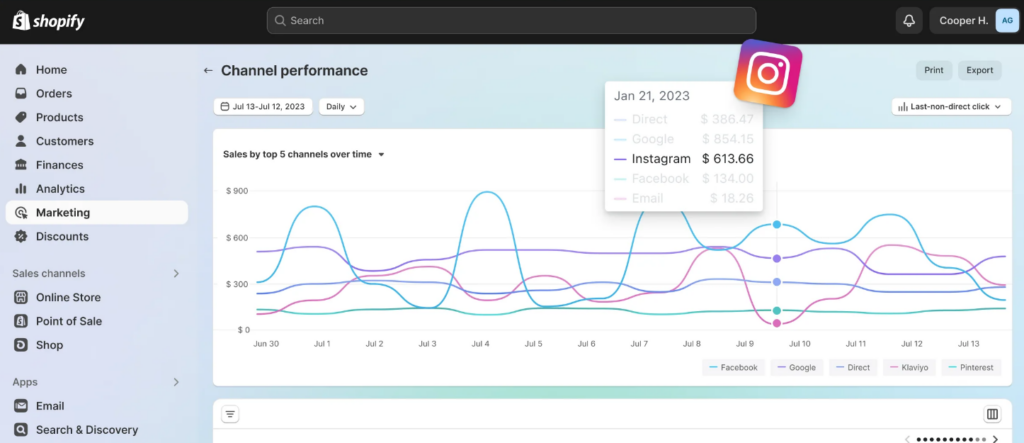
Marketing reports in Shopify allow you to monitor how your marketing efforts are doing.
It tells you how various marketing channels, like social media, organic traffic, etc., are bringing traffic and conversions to your store. With the help of these reports, you can understand what brings customers to your Shopify store and what encourages them to buy from you.
Source – Shopify
In addition, you can understand what marketing channels bring you the most valued customers and the highest number of customers in a given period.
Here are a few metrics that you can use within Marketing reports to improve your store’s marketing efficiency.
- Conversion by last interaction: It shows the number of orders from the previous interaction, meaning users who have not yet returned to the site since the last order.
- Sales attributed to marketing: This report shows you the number of sales that can be traced back to your specific marketing efforts.
- Sessions attributed to marketing: This metric explains the traffic generated to your store by specific marketing campaigns.
- Conversion by first interaction: This report shows the number of sales made by first-time visitors and their average order value.
- Attribution model comparison: This report compares your visitors’ first and last interaction data. It helps you determine if there’s a significant drop-off in customers who’ve purchased before.
Shopify Marketing reports can help you improve your marketing strategy and promotional efforts in diverse ways. Here are a few key benefits of using Marketing reports to improve your store’s performance.
- Based on the insights from these reports, you can decide where you must focus more and where you must stop investing for promotion.
- By analyzing sales by specific marketing efforts, you can optimize the marketing budget and ensure optimum resource allocation.
- These reports help you understand your customer behavior and tailor your marketing to meet these customer preferences.
- Marketing reports help you identify customer segments based on their purchasing behavior. This information helps you create targeted campaigns to improve sales.
- These reports allow you to track your campaign’s effectiveness across channels and improve them based on data.
6. Shopify Order Reports
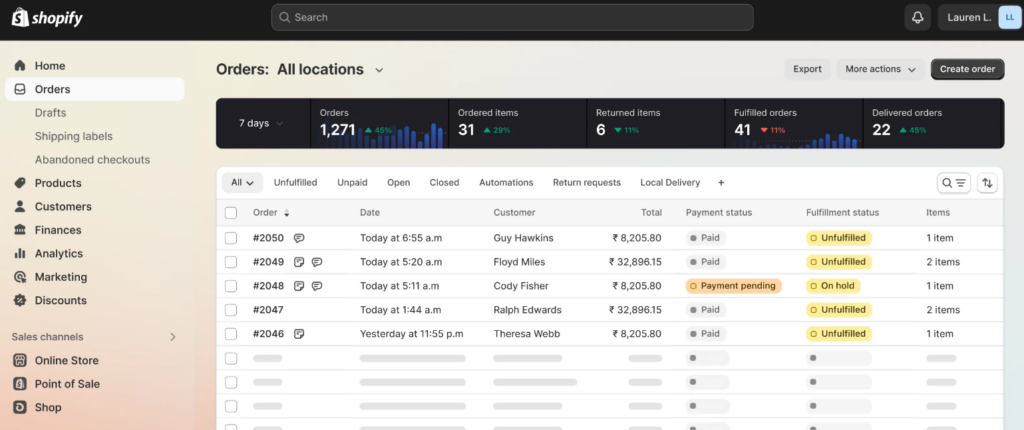
The order reports help you gain deeper insights into the order volume, shipping details, fulfillment status, the number of returns, and more. These reports help you understand which products are ordered the most and which ones are frequently returned.
With these reports, you can work on improving customer satisfaction and spot defective merchandise.
Source – Shopify
When you know the products or items that often get returned, you can analyze them to understand the issue and resolve it. Or you can remove it entirely from the inventory.
Here are some of the reports you can generate within Shopify Order reports.
- Orders over time: This report shows the total number of orders placed by your customers during the selected time range.
- Fulfillment, shipping, and delivery times: This metric helps you understand how much time your order takes to complete the fulfillment process, from the order placement stage to customer delivery.
- Fulfillment over time: You can see the total number of orders from your store that were fulfilled, shipped, or delivered to customers over the selected period.
The benefits of using Order reports are plentiful. They help you understand how efficient your fulfillment process is and how satisfied your customers are with it.
Here are a few benefits of using Order reports to improve your store’s fulfillment process.
- Order reports help you understand your best-selling products. This allows you to focus more effectively on inventory and marketing strategies.
- You can analyze fulfillment times with these reports to identify bottlenecks. These insights allow you to enhance the store’s efficiency and customer satisfaction.
- The reports allow you to track return statistics to pinpoint problematic products. These findings enable you to improve quality and marketing.
- You can develop cost-effective shipping strategies by tracking and analyzing shipping expenses with these reports.
- Order reports help you discover customer buying behaviors through order trends. Using these details, you can ensure targeted marketing efforts and promotions.
7. Shopify Credit Card Reports
These reports help you understand the credit card transactions in your store.
You can use these reports to know who uses credit cards to make payments when buying from you and how much payment was made. The report helps you understand the average order value of sales paid with credit cards and how long these transactions take on average for you to get paid.

Source – Shopify
There are several benefits to using Shopify Credit Cart reports. Here are some of the most important ones.
- Credit card reports help you gain clear insights into transactions. They show who paid and how much, leading to enhanced financial transparency.
- You can analyze the AOV of credit card orders to understand customers’ spending habits. This allows you to set pricing and promotional strategies accordingly.
- Tracking the average days to receive payments helps optimize cash flow management. You can also ensure effective operational planning with these details.
- These reports help you check unusual transaction patterns to identify potential fraud. Thus, you can enhance data security and protect business assets.
8. Shopify Customers Reports
Focusing on your customers is vital to delivering top-notch user experiences and building a successful business. In Shopify, the Customer reports are the best help.
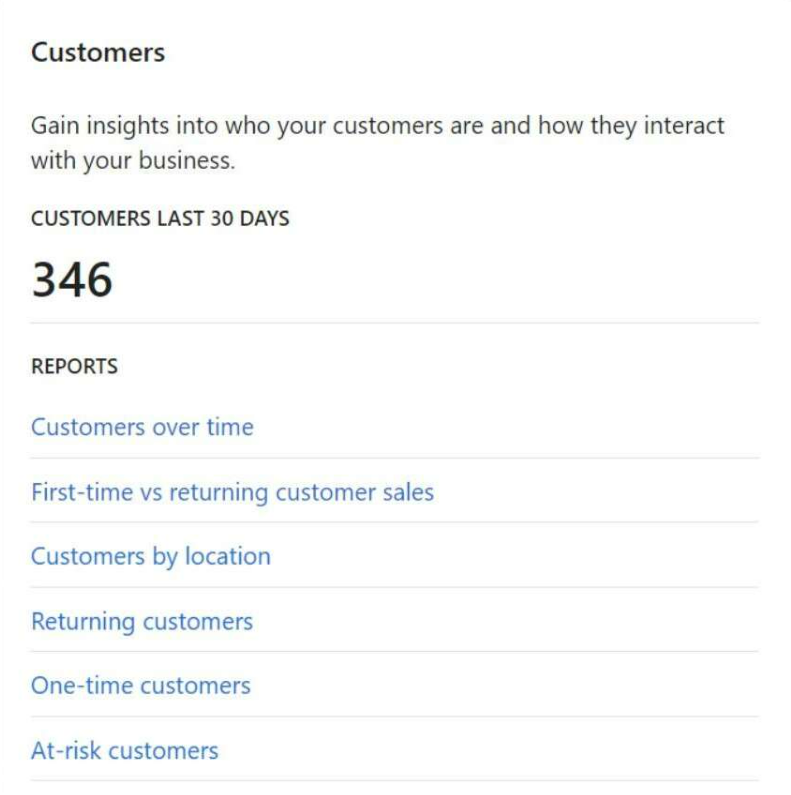
Customer reports provide all the information you need to learn about your customers. These reports help you understand how much each customer buys, what their purchase trends are, how much their average order value is, and more.
Source – Report Pundit
Customer reports allow you to generate reports specific to different metrics. They are more focused and offer you deeper insights into your customers.
Here are the top Customer reports you can use to grow your Shopify store.
- Customers over time: This report shows the number of orders your visitor places within your selected date range. This includes both first-time and returning customers who bought from you during the period.
- One-time customers: This report includes all the details of customers who have placed only one order from your store within the selected date range.
- Returning customers: Returning customers are your customers who have placed more than two orders. This report helps you understand the details of such customers.
- Loyal customers: This report contains data and insights from customers who frequently purchase from your store.
- At-risk customers: This report helps you understand customers who have not placed an order from your store in a while.
- Customers by location: This report allows you to understand your customers’ locations, how much they are spending, what the most popular product is for customers from each location, etc.
- First-time vs. returning customer sales: This report compares the value of orders placed between returning customers and first-time customers of your store within the selected data range.
Customer reports allow you to gain unique insights into your customers and their in-store behavior—products they buy the most, where they come from often, etc. As you get to know your customers better, it becomes easier to predict their behavior more accurately. Using this business intelligence, you can improve your marketing, pricing, and discounting strategies.
Here are a few crucial benefits of using Customer reports to grow your online store.
- Customer reports show who buys from you and how often they buy. These insights help you tailor ads and offers to meet customers’ needs.
- These reports help you understand and check repeat buyers quickly. Once you discover them, you can reward them with exclusive offers to boost retention.
- Customer reports help you analyze where your customers live and their interests. It makes planning targeted marketing campaigns based on geographic trends easy.
- These reports help you understand your customers’ spending habits in your store. Based on this, you can tweak your store’s pricing and promotional strategies.
- These reports also allow you to create customer segments for targeted marketing. It ensures that your messages reach the right people at the right time.
9. Shopify Profit Reports
You know that profit is a crucial metric you use to measure your online store’s success. Shopify reports allow you to check the overall profit of your store for a specific period of time. You can also use the reports to understand the cost of selling a product, including production, marketing, fulfillment, etc., your margin on the product, and the profit it generates.
Shopify merchants can generate different types of reports to help you get granular details about various aspects of your store’s reports.
Check them out below.
- Profit by product variant SKU: The report helps determine the profit by a specific product variant over the selected period.
- Profit by product: This report shows the profit generated by a product within the time period selected.
- Profit by Point of Sale location: This report shows the gross profit by point-of-sale location for merchants with many locations.
More than just helping you understand your store’s profitability or the products that make the most profit, Profit reports in Shopify can help you in diverse ways. Using these reports intelligently can help you in diverse ways.
Here are a few crucial advantages of using Profit reports to help your store.
- Profit reports show your earnings and help you track your store’s health and growth with reliable data.
- Using Profit reports, you can analyze costs associated with products. With these insights, you can adjust pricing and improve profit margins.
- These reports help identify the items that earn the most revenue and make the most profit. These insights can help you better decide on what to stock and promote.
- Profit reports help you track profit trends over time. This helps you understand seasonal patterns and adjust strategies as needed.
- Profit reports provide insights by location and aid in decision-making. This is useful for merchants with diverse retail spots or online stores.
10. Shopify Retail Sales Reports
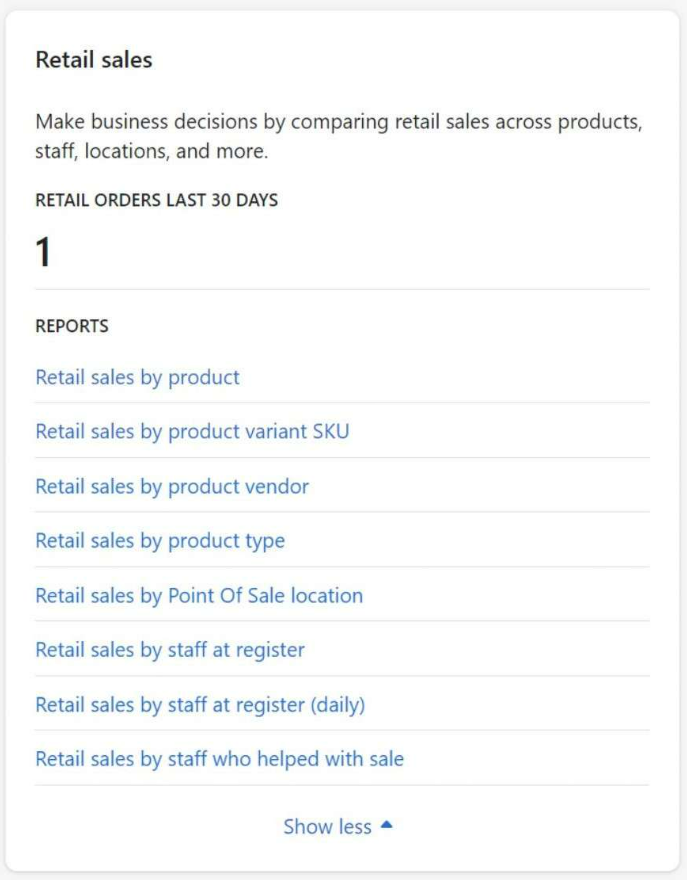
Retail Sales reports are vital for businesses that run physical stores along with online stores. These reports help you gather sales details about products, variants, and salespersons assigned to specific point-of-sale (POS) locations. A merchant who’s selling products in a physical store can get a lot of insights about the products and optimize their inventory and promotional strategies.
Source – Report Rundit
These reports help you understand how each store location performs and gather location-specific trends to adjust your inventory and discount strategies. A vital thing to remember is that only those merchants who sell products in a physical store can access these reports.
These reports are generated using the data from the Shopify POS payment channel.
There are several reports retail store owners can run to gain deeper insights into retail sales and performance.
- Retail sales by product vendor: This report compares data from different suppliers and the products provided by each categorized by the POS location.
- Retail sales by product type: Here, you can understand the sales of specific product types in each of your POS locations.
- Retail sales by product: This report shows you the total sales generated by different products.
- Retail sales by Point of Sale location: This report shows the total sales from different POS locations and which POS location performs the best.
- Retail sales by staff at register: You can use this report to understand the sales made by each staff member. This data allows you to set sales goals for POS staff.
- Retail sales by product variant SKU: Here, you can track the total sales generated by product variant.
- Retail sales by staff who helped with sale: This report provides data on sales attributed to specific staff members involved in processing line-item sales during checkout. It helps track which employees made sales based on the items they handled or sold.
Retail sales reports in Shopify can help businesses that run both online and offline stores immensely. As these reports help you drive product and customer insights, you can plan your sales and marketing strategy accordingly.
Here are some of the advantages of using Shopify Retail sales reports.
- Track sales made in-store with Retail sales reports and learn what drives the store’s growth.
- Analyze which staff members sell the most to improve promotions and team management.
- Understand which store locations perform best, helping you optimize inventory and marketing strategies.
- Identify top-selling products in retail settings for better stock management and promotional efforts.
- Gain insights into customer buying habits and improve marketing and customer engagement strategies.
11. Shopify Sales Reports
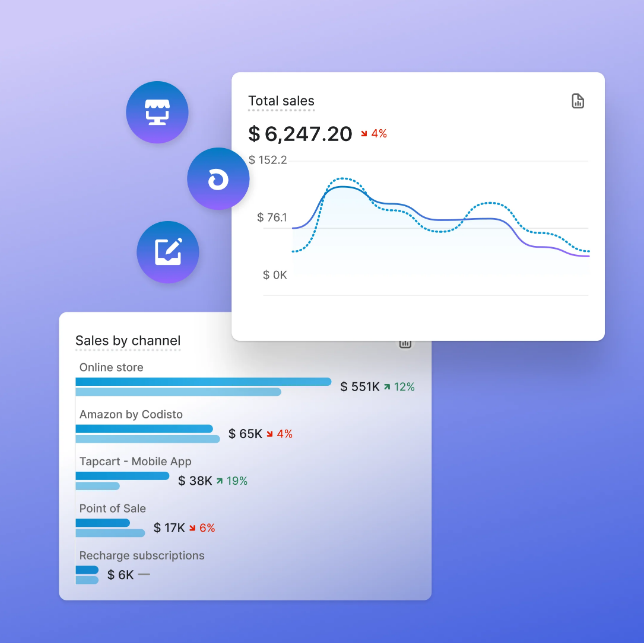
Getting a clear picture of your store’s sales is vital in many ways. It can help you understand bestselling products, learn who buys more, determine when people buy, and more. That’s what Shopify Sales reports can help you with. You can also discover which channels are growing and which are not.
Source – Shopify
Sales reports also help you understand the value of your sales over long periods to check the sales trend. You can also get deeper insights into your online store’s different sales metrics with the help of sales reports.
Here are some of the top sales reports you can generate in your store.
- Sales over time: This report shows the total sales and orders in your store within the selected date range.
- Sales by product: In this report, you can understand the total sales of a product.
- Sales by product variant SKU: In this report, you can understand the total sales of a product variant.
- Sales by product vendor: Here, you can understand the total sales by each of your vendors.
- Sales by discount: This report shows you the total sales under each discount offer used.
- Sales by traffic referrer: This report helps you understand sales by the traffic source, such as ads, Google search, etc.
- Sales by billing location: In this report, you can find the total sales grouped based on the location in the customer’s billing address.
- Sales by checkout currency: This report shows you the sales generated by different currencies used at checkout.
- Sales by channel: You can understand the total sales by different sales channels, like TikTok, POS, search, etc.
- Sales by customer name: This report helps you understand the sales by a single customer for the selected period.
- Average order value over time: This shows your store’s average order value trend for the chosen period.
As one of the most critical categories of reports in your store, Sales reports help you improve your sales. These reports offer you invaluable insights you can use to tweak your sales and marketing strategies.
Check out some of the top benefits of using Sales reports.
- Sales reports provide a clear view of total sales and help you understand performance and growth trends.
- These reports can help you track refunds and allow you to adjust strategies based on return rates.
- You can discover the bestselling items and create smart inventory and promotional strategies with insights from these reports.
- Sales reports help you analyze sales by channel. This enables you to focus your marketing efforts on the most effective platforms for the store.
- You can discover sales trends in your store over time. This enables you to tweak inventory and marketing strategies proactively for better sales.
12. Shopify Custom Reports
Although the different Shopify reports we have discussed help you understand your store’s performance, users, and sales, every now and then, you need something unique and custom.
This is where Shopify custom reports can help.
You can take the default reports available in Shopify Analytics and customize them according to your needs to create custom reports.
Here is how you can create custom reports in your Shopify store.
- Log in to your Shopify store.
- Go to Analytics from your dashboard.
- Click Reports.
- Select Create custom report.

Source – Shopify
Custom reports help you create unique reports with all the store details and metrics that you want to track. With these custom reports, you can gain deeper insights into your store that are unavailable with default reports.
While these reports can immensely help you understand how your store is doing, they do come with some limitations. Let’s understand that in the next section.
Limitations of Shopify Reports
Shopify reports offer overviews of diverse metrics on your store’s performance. However, many limitations prevent them from helping you comprehensively.
Let’s try to understand the limitations of Shopify reports here.
1. Limited data depth
Shopify’s reporting tools primarily offer high-level overviews rather than detailed analytics.
You will find that the reports lack the granularity needed for in-depth analysis, limiting you from driving deeper insights for strategic tweaks at some point.
2. Inaccurate attribution
Attribution of sales to specific marketing channels can be misleading in Shopify reports.
For instance, sales driven by email campaigns may be misattributed to ‘Direct Traffic’ instead of ‘Email Marketing.’ This can lead to confusion about the effectiveness of your marketing efforts.
3. Session tracking limitations
Shopify records each session for only 30 minutes. If a user is inactive for longer than this period, their session ends. Any customer activity later may not be attributed to the original traffic source.
This may cause disparities in reporting, especially for users engaging with your site for more extended periods.
4. Data export constraints
Shopify reports can only display a maximum of 1,000 rows per report.
This restriction can stop you from analyzing larger datasets or managing extensive inventories. It requires you to analyze data externally for comprehensive insights, which is a huge inconvenience.
5. Customization limitations
While some customization options are available within Shopify reports, their scope is limited.
You cannot use advanced filtering or create complex comparative analyses within the platform. Further, sophisticated analyses need integration with tools like Google Analytics or Power BI.
6. Visualization limitations
Shopify reports drop the ball entirely when it comes to data visualization.
Yes, there are basic options like graphs, tables, charts, and basic customization options. However, it lacks advanced visualization options and customizations. This limits store owners from driving insights that are available with a dedicated data visualization tool.
;
The obvious question you may have in your mind right now is how you can overcome these limitations.
Well, you can use custom Shopify apps to better use these reports. Let’s learn about these apps in the next section without further ado.
Apps to Overcome the Limitations of Shopify Reports
Despite its numerous reports, Shopify allows you to integrate various third-party tools for better reporting and data analysis.
Here are some of the top reporting tools for Shopify.
App #1: Report Pundit
- Rating: 5/5 from 1,660+ Reviews
Report Pundit is a robust reporting tool designed for Shopify users. It offers extensive customization and automation capabilities for data analysis.
Here are a few features of the app.
- Create tailored reports based on your business needs.
- Use pre-built reports covering key metrics for quick access.
- Export reports in various formats, such as Excel, CSV, and PDF.
- Schedule reports to run automatically at specified intervals and save time.
App #2: Data Export IO: Reports
- Rating: 5/5 from 2,250+ Reviews
Data Export IO: Reports is a Shopify reporting tool that allows you to create customized reports and automate data analysis. It offers diverse pre-made reports, advanced filtering options, and seamless app integration.
Some of the top features of the app are given below.
- Design unlimited custom reports tailored to your business needs.
- Merge data from multiple locations for inclusive store insights.
- Apply complex filters to refine report data for precise analysis.
- Automate report generation and delivery on a set schedule.
- Export reports in diverse formats, such as Excel, CSV, etc.
App #3: Better Reports
- Rating: 4.9/5 from 1,115+ Reviews
Better Reports is a powerful reporting and analytics tool designed for Shopify users. It helps you explore your store data and automate report generation.
Here are a few of the app’s top features.
- Ideal for stores selling internationally as the app supports multiple currencies.
- Analyze metrics, such as sales, payments, etc., using pre-built reports.
- Develop tailored reports using specific metrics, fields, and formulas.
- Schedule automatic report delivery via email or Google Sheets.
- Request assistance from the app team to create custom reports.
Conclusion
Using Shopify reports helps you understand how your visitors behave, what products they want to buy, and where they are coming from.
All these insights allow you to plan your sales, inventory, and marketing strategies.
They also help you understand areas that need your attention to improve the store’s performance. We hope the guide has helped you understand how to use Shopify reports to enhance your store’s performance and tweak your strategies.
At the same time, you can also use various third-party apps and tools to use these reports more effectively. These tools expand the analytical and reporting capabilities of the Shopify platform.
If you need any help with integration of third-party apps, our Shopify developers at Aureate Labs are highly proficient and can help you use the reports to optimize your Shopify store’s performance.
Contact our team to get a free consultation.


Post a Comment
Got a question? Have a feedback? Please feel free to leave your ideas, opinions, and questions in the comments section of our post! ❤️