GA4 Funnel Exploration Report — Understand Your Customers

You bring many people to your store, be it through organic traffic or paid ads, but conversions barely touch 1%.
The worst part? You can’t pinpoint the reason behind it.
- Is it the product pages?
- A complicated checkout process?
- Or that your visitors simply do not find what they need?
Even the older version of Google Analytics didn’t share much to understand the real cause.
The only good funnel reports were related to “Enhanced Ecommerce” (which shared insights into users’ shopping and checkout behavior). And that’s quite mediocre information to predict the issues.
However, with the rise of GA4, Google has fixed this issue by providing a Funnel Exploration report.
With funnel exploration reports, you can now map user journeys, from their arrival on your website to the moment they take the desired action, or till they drop off. And all along you get data on where they drop off, why they drop off, and what’s their next stop.
(as long as you have been collecting events for a while).
By visualizing each step in the conversion process, GA4 funnels give you clarity on where you need to optimize your store’s performance and turn more visitors into loyal customers.
In this article, we’ll learn about the following areas.
- What it is
- Its interface components
- What makes it so important for your eCommerce business
- The use cases
- How data is calculated for open and closed funnels
- & some additional reminders for you
Let’s start with it.
“First Things First”
What will you require to achieve such Magical reports?
- A website that shoots Google’s standard events (An obvious thing!)
- A Google Analytics Account (A second obvious thing)
- A little bit of analytical eagerness to prepare these reports.
(We’ve another blog coming for you addressing this query. Stay tuned.)
Well, for now, let’s continue learning the funnel exploration reports of GA4, the magical reports as I said. 😉
What Is Funnel Exploration in GA4?
Funnel Exploration in Google Analytics 4 (GA4) helps you visualize how users navigate through your website to complete a task and see how well they are succeeding or failing at each step. The exploration into funnels allows you to map out the customer journey—like visiting a landing page, viewing a product, adding it to the cart, and completing a purchase.
These funnel reports are essential tools for businesses and website owners to identify critical drop-off points which helps understand where users leave the funnel before completing the desired action. The visualization of stages in the user journey helps address bottlenecks and improve the flow toward conversions.
GA4 has two prebuilt funnel exploration reports:
- Purchase Journey
- And Checkout Journey.
Apart from that, you can create custom funnel exploration reports to gain insights into specific areas.
Let’s understand the report interface.
Understanding Interface for GA4 Funnel Exploration — Main Components!
First of all, there are two types of pre-added funnel exploration reports in Google Analytics 4 (GA4).
This is what a purchase journey report in GA4 looks like.
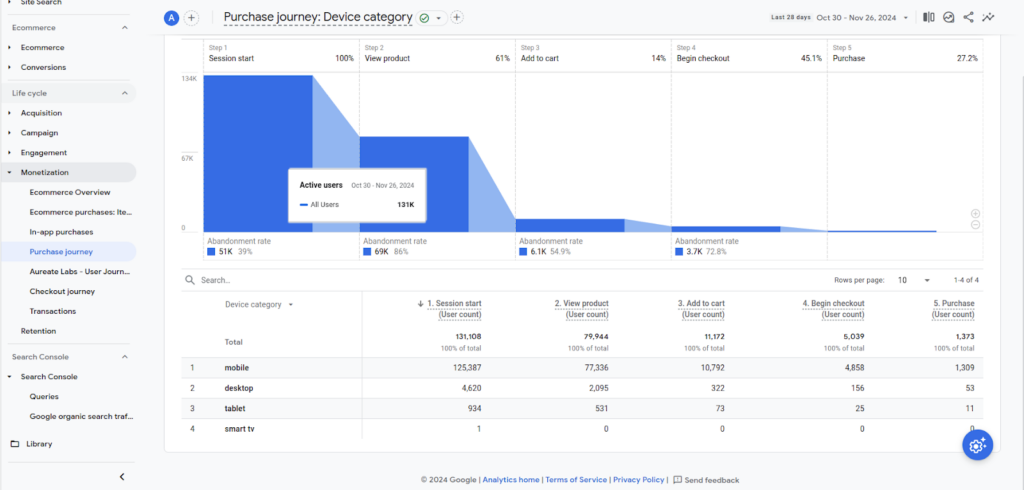
You can see that the report uses bar graphs to help visualize the number of users who perform a particular step.
The report easily shows that out of the total users who started a session, how many of them viewed a product, added a product to the cart, began to check out, and completed the purchase – data on the entire purchase funnel.
Below that, you can see the device category dimension, highlighting the types of devices visitors use to access your website. You can also explore additional dimensions like country, browser, language, and more to gain deeper insights.
Similarly, here’s the checkout journey funnel exploration report from GA4.
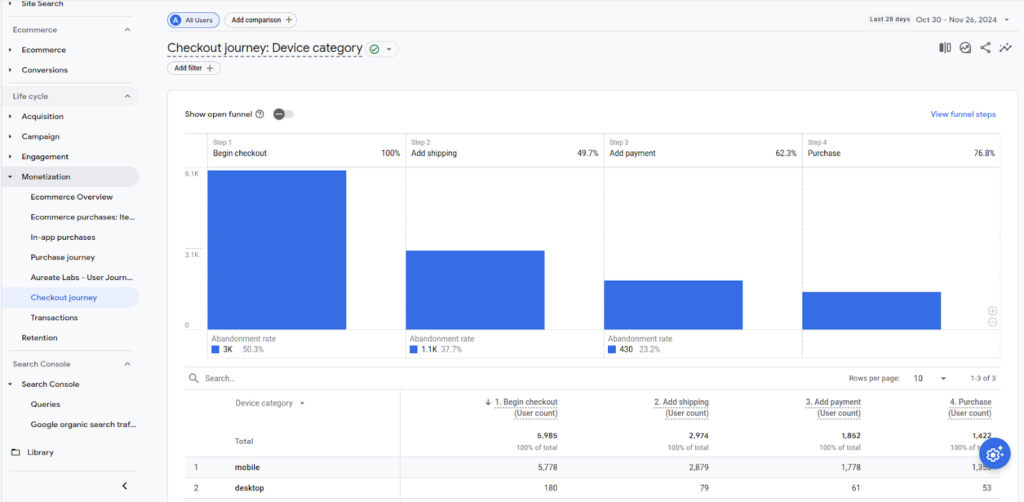
With a similar interface, this report helps you map steps users take after initiating the checkout process till the completion of the purchase. Apart from these, you get an option to create custom funnel exploration reports (both blank and a pre-configured sample report that you can customize).
Here’s a glimpse of the configurable funnel exploration report from GA4.
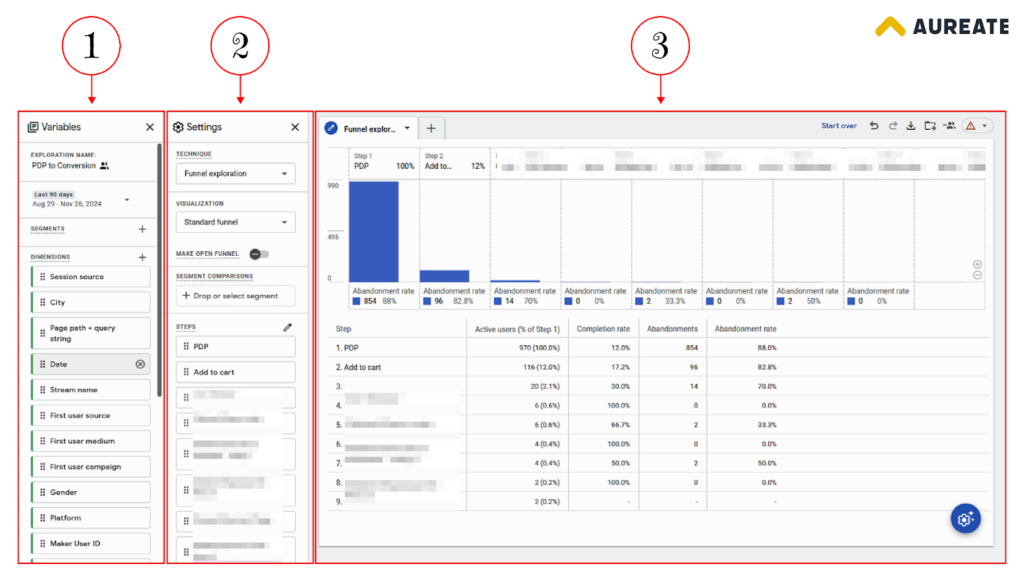
The interface of the configurable funnel exploration report is split into 3 sections.
(1) Variables:
This section of the report helps to configure data based on date range, segments, and dimensions.
(2) Tab Settings:
Here, you can configure how your report would look like. You can choose between Standard or Trended Funnels, define steps, and compare up to four segments. Additionally, features like Open Funnel, Closed Funnel, Breakdowns, Elapsed Time, and Next Actions provide detailed insights while filters help focus on specific data, such as events or pages.
(3) The Report:
The Funnel Exploration report that you get to generate based on your configurations.
Overall, the GA4 Funnel Exploration report is more than just a static report that you can customize. Let’s further check on why it’s important for your eCommerce business.
What Makes GA4 Funnel Exploration Reports Important?
GA4 Funnel Exploration Reports are important for your eCommerce as they help you look deeper into what your customers are doing on your website, and where they get stuck in the sales funnel. AKA your guide to improvement.
However, that’s just one of the reasons why you need to track funnel exploration reports.
Apart from that, GA4 funnel exploration shares many more insights that help you make wise decisions in favor of better revenue.
Let’s check on them.
1. Helps With Conversion Tracking
We all know, tracking conversions is one of the most important aspects of running a successful eCommerce business.
With GA4 Funnel Exploration, it’s improved as you’re not left guessing. The report helps you monitor conversions deeply as they happen, showing you exactly how users interact with your site at each stage of their journey. This means you can understand their behavior when they are making a purchase, understand what’s working, and areas they felt stuck—all in real-time.
2. Helps Identify Abandonment Points in Conversion Paths
The sales funnel graph tends to decline for every eCommerce business, and yes, it’s common.
This is because not every visitor on your website will make it to checkout. Either they get lost in product browsing, or they don’t find value for purchase, or the checkout process bores them.
But exactly, you don’t know what’s causing the issue, it’s all a mystery on what’s taking away the interest of your customers.
However, the visual funnel exploration report in GA4 takes the guesswork out of the equation.
With its visual reports, you can see where users drop off and what their next steps are.
For example, if you see that many people are abandoning their carts on the product detail page, it could be due to a lack of information on the product page, low-quality product visuals, or a lack of social proof.
In short, you get to identify the specific areas where you can improve.
3. Customize Conversion Funnels
Every business has its own unique sales funnel, and understanding the steps in the funnel is how you improve conversions.
With GA4 funnel exploration reports, you get the flexibility to fully customize funnel steps, allowing you to track the way you want.
For example: Some businesses may want to focus on tracking how users move from adding products to the cart to completing the checkout, while others may need to analyze behavior at multiple touchpoints, like product views, cart additions, wishlists, and even newsletter sign-ups.
And GA4 allows merchants to create funnels that are as simple or detailed as needed, based on their particular sales process.
When you customize funnel steps to match your business’s needs, you can get a much clearer understanding of how well users are moving through the journey, identify areas for improvement, and adjust your strategies to optimize performance.
4. Segment Audiences Easily
Another thing GA4 helps with is audience segmentation which helps greatly to market your eCommerce store effectively.
What GA4 allows is breaking down users into specific segments based on a variety of criteria—such as location, device, campaign source, purchase behavior, or even engagement patterns.
This helps you gain a much deeper understanding of how different customer groups behave on your website.
The segmenting option provided by GA4 is way advanced and goes beyond basic demographics. You can create segments based on specific events or user behaviors, like users who added items to the cart but did not check out, or users who spent a certain amount of time on the site but didn’t convert.
For example:
Consider you’re a fashion store.
The behavior of users from New York engaging with a specific campaign will likely differ from users in California for the same campaign. To get insights into their behavior, GA4 allows you to create custom segments based on different attributes.
With this, you can easily track how each group progresses through the sales funnel and identify specific pain points or opportunities for optimization.
With this level of insight, businesses can understand the nuances of their audience and develop more effective, personalized marketing campaigns. This helps ensure that you’re not only reaching the right people but engaging with them in a way that meets their unique needs.
5. Helps Optimize User Journeys
Even a small friction point in the user journey can cause big harm to conversions.
The insights provided by GA4 on how long users spend between each step of the funnel highlight where they might be getting stuck or losing interest.
Additionally, it shows the most common next actions users take, which can help you understand more about the customer journey.
Such as; what actions lead to conversions and which ones might be causing drop-offs.
By analyzing this data thoroughly in the funnel exploration report, you can make informed decisions on where to improve navigation, reduce unnecessary steps, and speed up processes like checkout.
6. Measure Campaign Effectiveness
Understanding if your campaign efforts are driving results is necessary.
GA4’s Funnel Exploration report works best as it helps visualize user actions for specific campaigns.
By visualizing how users move through the funnel after engaging with a particular ad, promotion, or email campaign, you can understand the effectiveness of their marketing efforts in real-time.
So, when you have an idea of if the campaign is working for better ROI, you can strategically allocate your resources. Or, can discontinue underperforming ones.
7. Allows A/B Testing Of Your Website Structure
Yes, funnel exploration can also help you A/B test website structure or even specific web pages.
GA4’s Funnel Exploration report provides a clear and data-driven way to compare the performance of different funnel versions.
You can easily track how changes to your website, such as new designs or altered navigation, impact user behavior across the funnel stages. Some of the key metrics like drop-off rates, time spent at each step, and conversion rates before and after the changes, can make informed decisions about what works best for their audience.
;
So, these are some of the reasons why you should consider using GA4 as part of your CRO optimization strategy for your eCommerce business. Now, let’s also check on some additional use cases of funnel exploration reports.
GA4 Funnel Exploration: Use Cases
In this section, we’ll discuss use cases of funnel exploration reports from GA4, a deeper dive into areas you get control of to fetch better data insights on what’s happening in your online store.
1. Visualization
First, with a funnel exploration report, you get a visual representation of user progress through a funnel.
There are two types of visualization available in GA4:
- Standard
- Trended
Here, I’ve attached a screenshot of the standard funnel visualization.
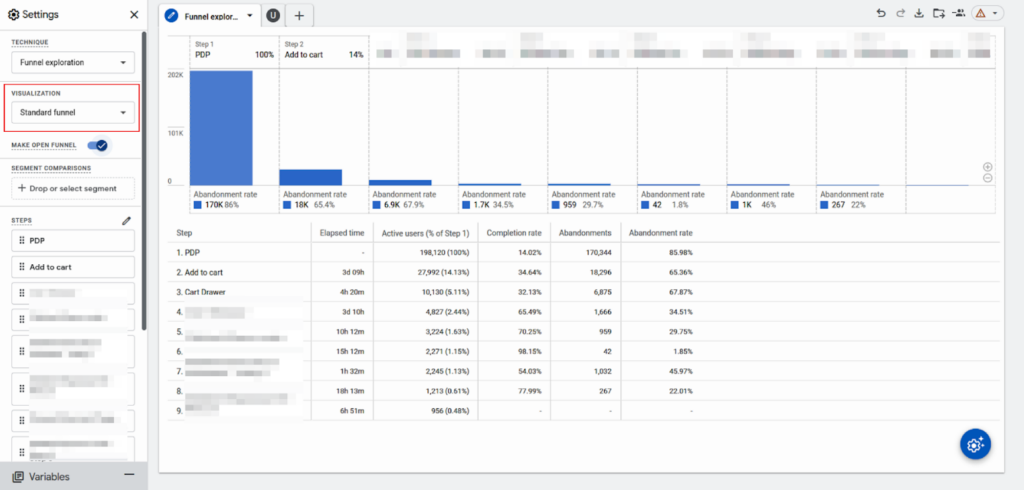
The interface of the standard funnel includes a chart where each bar represents a specific step in the funnel.
You can see that the size of the bars decreases as users drop off.
Also, the funnel chart is interactive, allowing you to hover over each step to view precise numbers and percentages, such as the total users who entered, continued, or dropped off at that stage.
GA4 also provides a trended funnel visualization chart, here I’ve attached an image for the same.
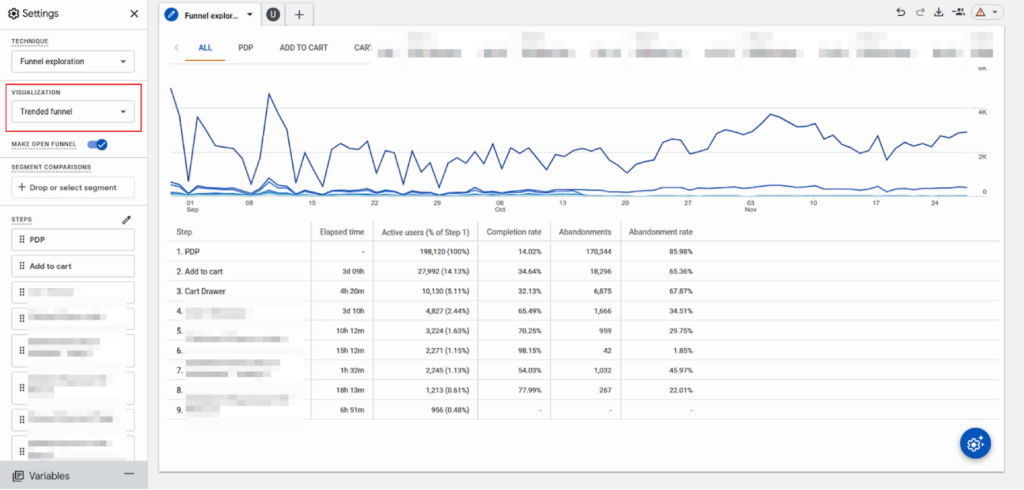
In a trended funnel visualization within GA4, you get a layered view of all the steps in the funnel at once, displayed across a timeline, helping you identify patterns, trends, or anomalies in user behavior over time.
Lastly, below the chart, you can find supporting tables or metrics that break down the data further, making the interface comprehensive for detailed analysis.
2. Open/Closed Funnel
Next up, in the GA4 Funnel Exploration report, you can choose to see a report for both open funnels and closed funnels. What It Is:
(1) Open Funnel
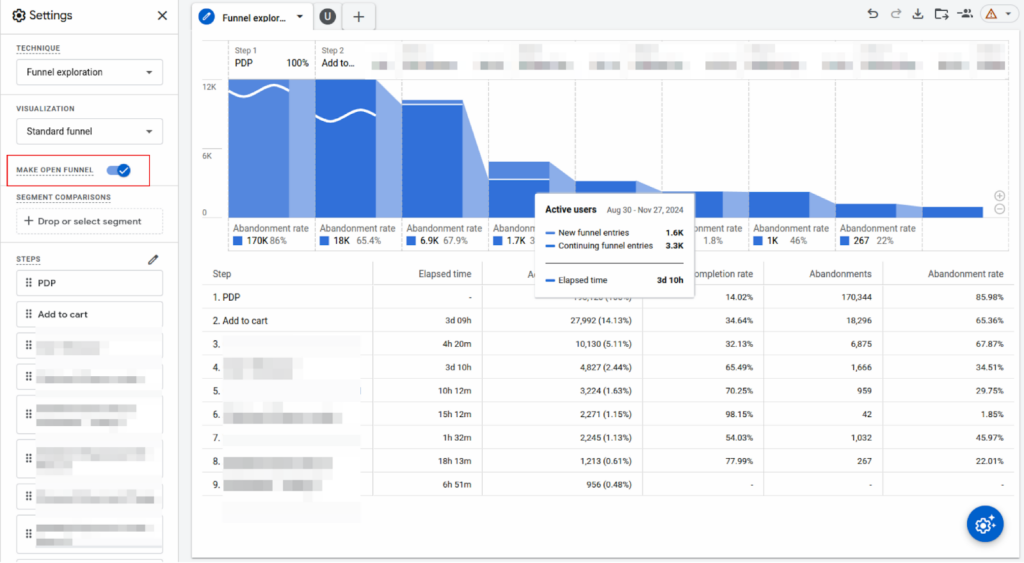
Open funnels help understand broader user engagement by not restricting the analysis to sequential progress.
If that’s confusing, with an Open Funnel in GA4, you can see data on users who enter the funnel at any step, even if they skip earlier steps or start from the middle of the funnel.
For example:
“A user might land directly on a product page (skipping the homepage) and proceed to checkout (skipping the add to cart).”
In an open funnel, their actions would still be included in the analysis, helping you understand overall user engagement, even when users don’t follow the exact journey that you planned for funnel steps.
(2) Closed Funnel
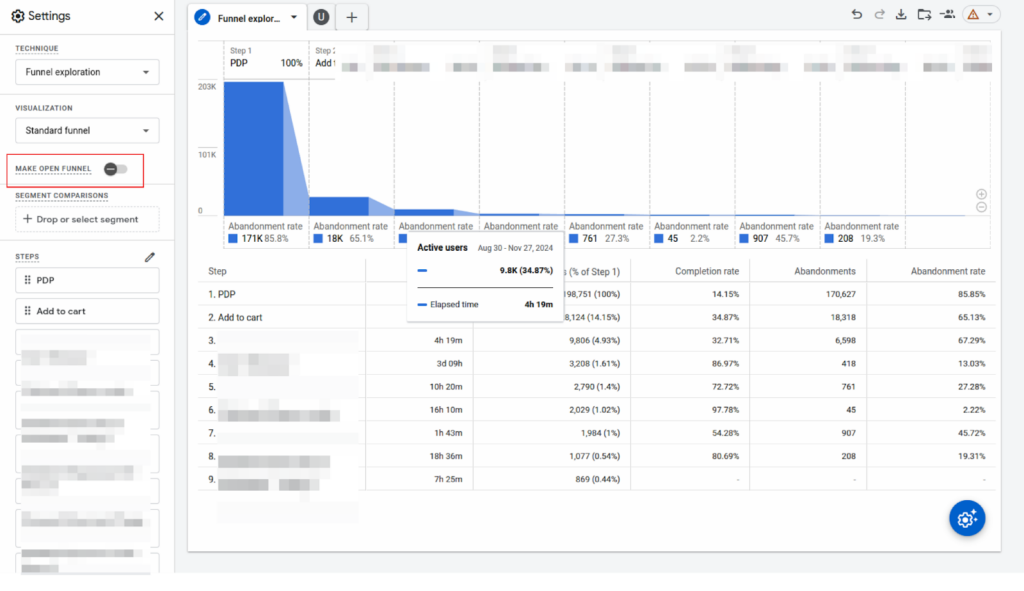
On the other hand, a closed funnel requires users to enter at the first step and progress sequentially through all subsequent steps.
So, to get a count in funnel data, users must start at the first step and follow all the sequences step by step.
For example:
If the funnel starts with a homepage, moves to product browsing, and ends with checkout, only users who follow this exact sequence are included in the closed funnel.
This helps you get an idea of user behavior, such as where they drop off exactly, helps reveal how the funnel path is working
Since the closed funnel helps you track users strictly following the funnel from beginning to end, you get a clear and focused view of the performance of each step. This helps you evaluate whether the funnel path is working as intended or if specific steps need optimization.
3. Funnel Steps
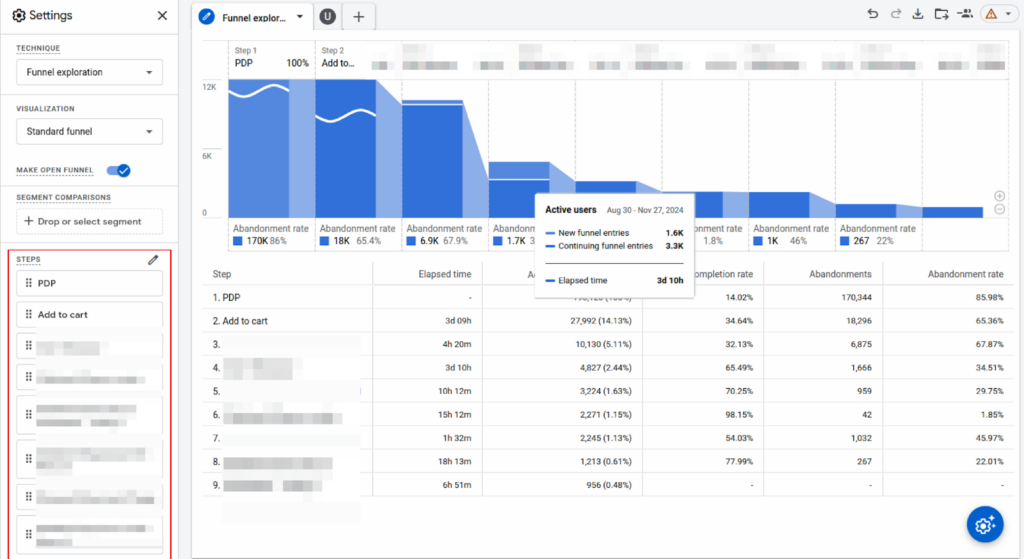
Moving further in details, you can put up specific funnel steps in custom exploration reports to fetch data on custom areas.
For example, your funnel steps might include:
- Homepage Visit
- Category Page View
- Product Page View
- Add to Cart
- Checkout Initiation
- Purchase
This is just a classic example, you can work on your goals and specific areas that you target and add them here to design the report output. With this, GA4 allows you to isolate and analyze user behavior at each stage, giving you insights into where users progress smoothly and where they drop off.
The beauty of this feature is its flexibility—you can add, remove, or reorder steps to suit different campaigns, products, or user segments.
4. Segment Comparisons
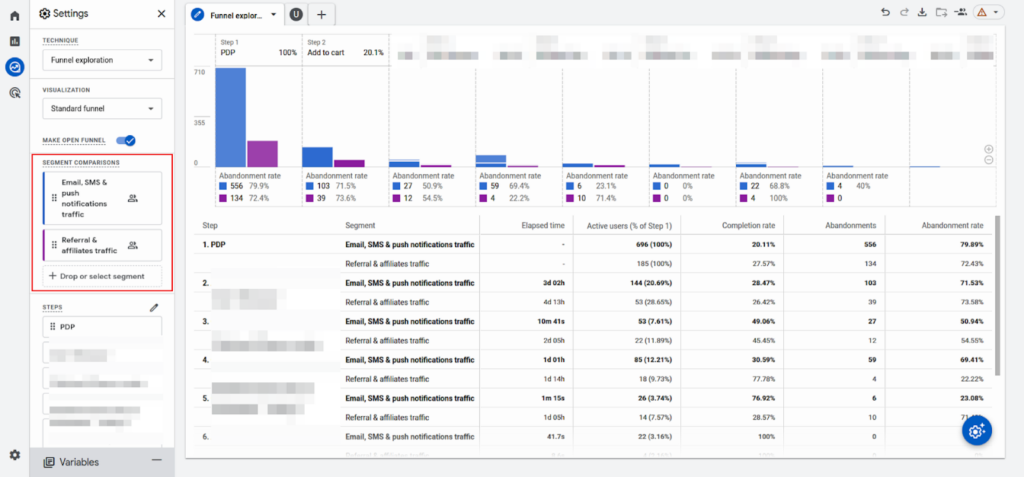
Next up, you can see an option for Segment comparison in GA4 Funnel Exploration.
This feature allows merchants to analyze how different groups of users navigate through the funnel. Now as you get to compare user segments side by side, you can discover patterns, behaviors, and bottlenecks unique to specific audiences. Ultimately it will help you improve your campaigns and user experience on your website.
5. Breakdown
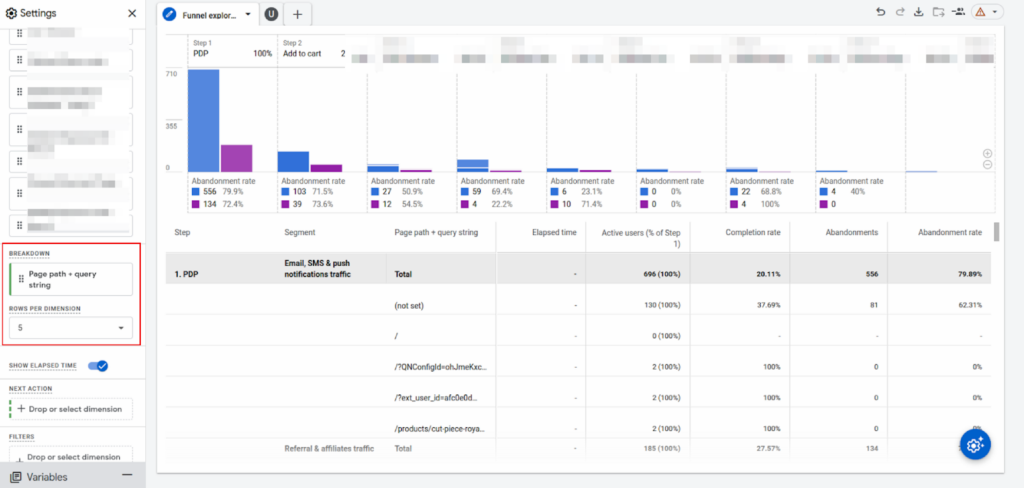
Another way you can use this report is by splitting up your funnel data into meaningful categories or attributes, using the breakdown feature. The breakdown feature helps uncover multiple nuanced insights that might be missed in an overall view.
It answers questions like:
- Which devices have the highest drop-off rates?
- Are there regions where users complete the funnel faster?
- Which campaign sources lead to higher conversions?
Overall, it helps you find patterns and anomalies specific to each category. So, you (as a merchant) can take targeted actions, such as optimizing mobile interfaces, personalizing marketing messages for certain regions, or re-doing underperforming ad campaigns.
6. Next Action
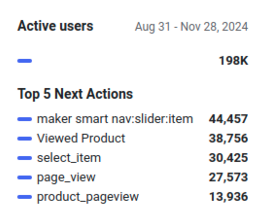
Another great use case of GA4’s Funnel Exploration report is that you get data on what users do immediately after they exit a particular funnel step. For example, let’s say a lot of users drop off after viewing the product page but before adding items to the cart.
There’s a NEXT ACTION feature that helps you track what most users do next.
So, if you find some user dropping off at the same point in the funnel and want to figure out why that’s happening, you can check on what’s their next stop. This provides you with better insights. Such as:
- Spots where users leave the funnel.
- What do users go next for deeper understanding?
- Find out if users are stuck or unsure.
- Pinpoint issues like missing info, slow load time, or unclear CTAs.
7. Custom Events & Filtering
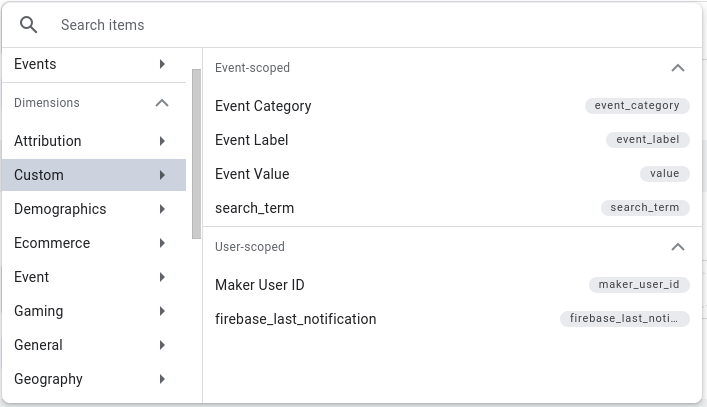
Next up, while tracking on funnels, you can also set up custom events to track specific actions that are important to your eCommerce business, such as button clicks, video views, or product interactions.
These custom events help you measure user behavior beyond the standard events.
Also, once you set up custom events, you can use filters to narrow down your funnel analysis to those particular events. This helps you focus on specific user actions that drive conversions, or identify where potential customers are getting stuck in the funnel.
8. User Explorer
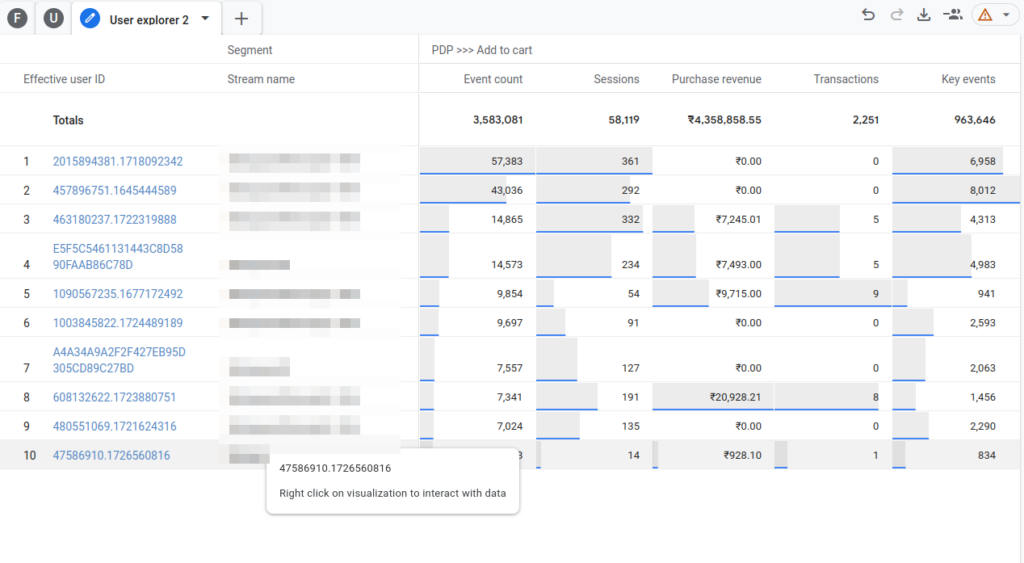
There’s another feature of GA4 funnel exploration where you can understand the behavior of individual users on your website.
Instead of looking at combined data, here you get to see the actions taken by each user, such as pages viewed, events triggered, or purchases made. This helps you check on:
- Friction points
- Where users left
- Adjust strategies
- Retargeting chances
- Fix errors
… and more to identify areas of improvement in your sales funnel, website structure, or customer journey.
;
That’s all.
Going through various use cases of funnel exploration reports of GA4, you can see how deep insights you can get to understand customer behavior and identify loopholes to improve the user flow toward conversion.
Wrapping Up
We understand the amount of effort that goes into making an online store that converts well.
Every small thing has a big impact on your customer’s next step, and funnel exploration reports help you know things that you can only predict otherwise. Hence, a real good consideration for the times when you choose to optimize the conversion rate for your online store.
Moreover, we specialize in building custom Funnel Exploration Reports that can help you identify gaps, bottlenecks, and opportunities in the user journey of your eCommerce store. Our eCommerce experts are pleased to help you out.


Post a Comment
Got a question? Have a feedback? Please feel free to leave your ideas, opinions, and questions in the comments section of our post! ❤️