How to Use Shopify Analytics to Plan for Black Friday and Cyber Monday

The Black Friday/Cyber Monday season is fast approaching. Knowing what motivates your customers to buy is key to planning a successful BFCM season.
Many Shopify merchants find it hard to properly plan their BFCM strategy.
(You might be one of them.)
Instead of guessing what might work, what you need is data to understand how your customers behave during the BFCM season. And “Shopify Analytics” is a goldmine that brings you all the data you need to understand user behavior and build a data-backed BFCM sales strategy.
This native Shopify reporting tool enables you to analyze previous sales data and industry trends, allowing you to predict audience behavior. Using these data-backed insights, you can create a smart BFCM sales strategy for the 2024 season and make it the best one yet.
But Shopify analytics offers a plethora of metrics and reports. Where should you focus on, what metrics should you use, and, more importantly, how should you use them?
Let’s figure out all of it in this guide, starting with some basics.
What is Shopify Analytics?
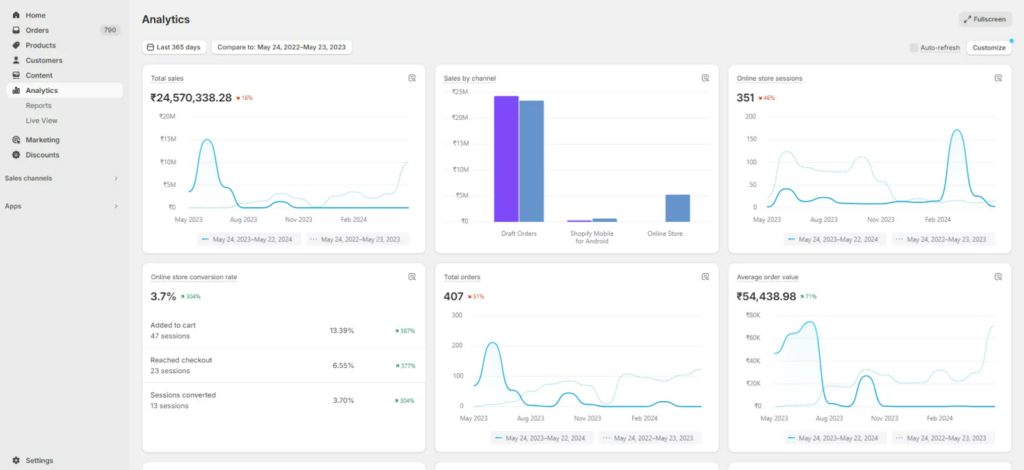
Shopify Analytics is a reporting tool designed for merchants using the Shopify platform to sell products and services online.
The tool helps merchants learn how their online stores perform by analyzing customer behavior, sales trends, product performance, and more. But, Shopify analytics is much more than a tool for collecting raw data. It helps you improve your store through data-driven business intelligence.
- Acquisition reports
- Behavior reports
- Customer reports
- Inventory reports
- Marketing report
Now, let’s check the role of Shopify analytics in helping you build smart sales and promotional strategies for the upcoming BFCM.
Role of Shopify Analytics in BFCM Decision-making

Fetching accurate data is key to planning successful BFCM sales.
When you have past sales data and current trend forecasts, you gain a better idea of what your customer wants to buy this Black Friday/Cyber Monday season.
So, when you’ve done your data research thoroughly, you can plan things carefully and avoid situations such as running out of popular items or offering too many items at a lower price point that still don’t sell well.
And Shopify Analytics helps you address these challenges.
The tool offers you comprehensive BFCM data insights on areas you would care most to run a successful Black Friday/Cyber Monday campaign.
The list includes insights on areas such as;
- How well your store is performing,
- Where users are coming from,
- Who’s buying,
- Top-selling products,
- Customer behavior and their purchase patterns,
- Inventory,
And much more can be found on the Shopify analytics dashboard, which helps make informed decisions and organize things better for upcoming BFCM sales.
Let’s dissect more on how these insights on Shopify Analytics can help you make data-backed decisions.
1. Create targeted marketing and promotions.
Shopify analytics is your single most crucial ally in creating an uber-successful BFCM (or any other sales season, for that matter).
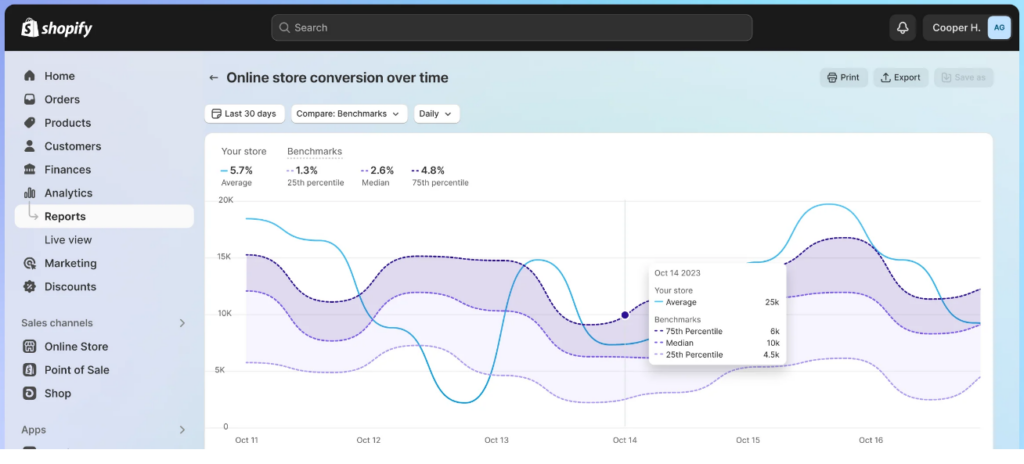
It helps you understand:
- Who comes to your store—demography, age, and gender.
- Where they come through—search, social media, and affiliates.
- What they want—their preferences, interests, and past behavior.
- How they interact with the store — clicks, page views, and sales.
Based on these details, you can create targeted advertisements and promotional campaigns.
Analytics helps you understand who visited your store and what products they interacted with. It lets you filter data by customer groups, such as first-time buyers, repeat customers, or customers in specific locations.
With this segmentation, you can create targeted promotions and campaigns tailored to each group’s preferences.
2. Optimize inventory and reduce stockouts.
A study by IHL Group on inventory distortion gives two interesting insights:
- Out-of-stocks lead to a loss of USD 456.3 billion
- Overstocks lead to USD 362.1 billion.
Running out of stock is a nightmare for Shopify merchants. It is the last thing you want to happen during the BFCM sale. And at the same time, you also don’t want to overstock.
Shopify analytics can also help you here. Use the analytics to look at your previous year’s sales and determine the products that were high in demand and sold out.
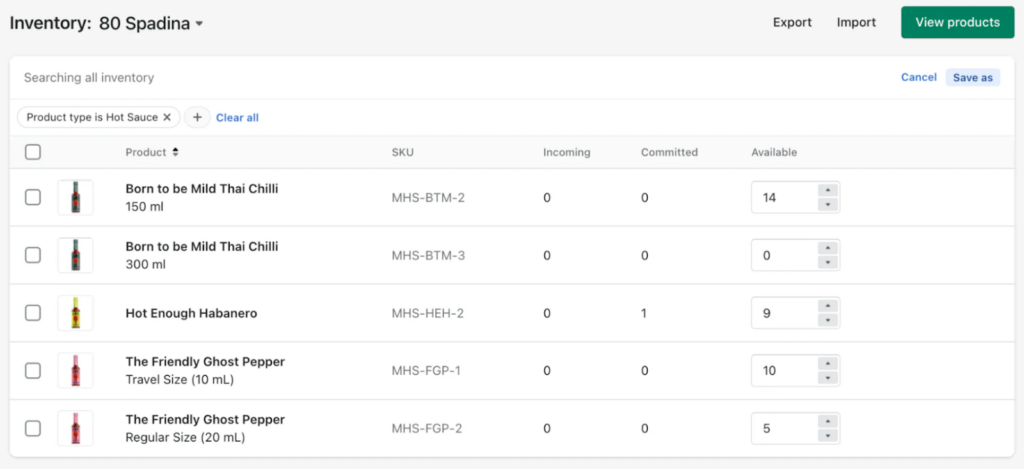
Once you have the insights, go on and research the market. Based on your store insights and market research, discover the products that will surge in demand.
Then, optimize your inventory and reduce stockouts based on the data available.
3. Improve customer experience using behavioral data.
Shopify analytics also provides diverse insights into user behavior. It tells you how customers interact with your store—how they visit, navigate, and browse products.
With analytics, you can figure out:
- Which pages have the highest bounce rates?
- How easy is it for customers to find products?
- How much time a customer spends on each page, etc.
You can find the answers with Shopify analytics and make data-driven decisions to improve website navigation, product recommendations, and overall customer satisfaction.
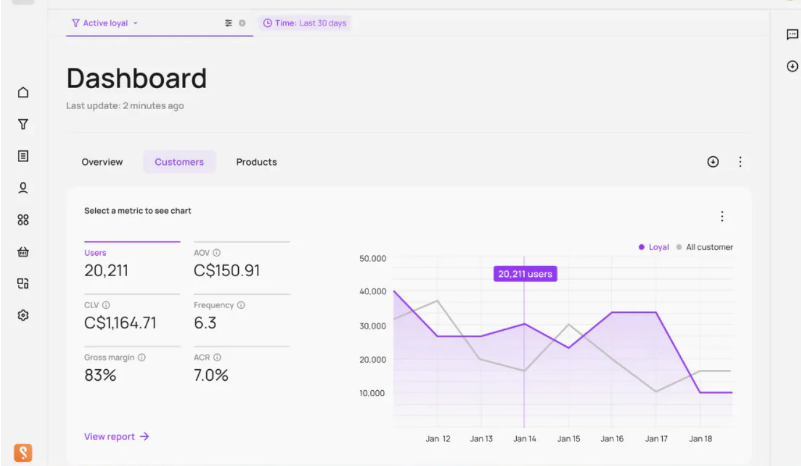
Customer behavior on the checkout page is another crucial data to analyze.
- Do you experience high cart abandonment?
- Does your cart page take too much time to load?
- Are these unnecessary data fields on the checkout page?
Figure out answers to these questions with the help of Shopify analytics and optimize your store’s checkout experience for better user experience and revenue.
You don’t want to spend a lot of effort to bring customers to your site only to lose them due to poor customer experience. Do you?
4. Data-driven insights to build customer loyalty.
In the US, 80% of consumers say that they are loyal to a brand, showing how integral customer loyalty is for business growth, especially if the brand is not huge.
To build customer loyalty, you must understand customer behaviors, preferences, and purchasing patterns. And we can get this data from Shopify analytics.
It brings you sales and customer reports and deep insights into the customers’ purchasing behaviors.
— What products are they usually buying from you?
— How much is their average cart value?
— Who is returning to your store, and how often?
— What products are they buying over and over again?
Shopify Analytics has all the answers.
Once you have the insights, combine them with promotions and advertisements. Create personalized product recommendations and email exclusive discounts to your customers.
When running deals, make them available to your regular customers a few hours before.
All these will make your existing customer base more loyal to your brand.
5. Create dynamic pricing strategies for higher revenue.
As a business, creating dynamic pricing is immensely beneficial. Especially, during a holiday like BFCM this strategy will work wonders for your sales.
But how do you strategize it? Where can you get reliable data for dynamic pricing?
Shopify analytics is the answer.
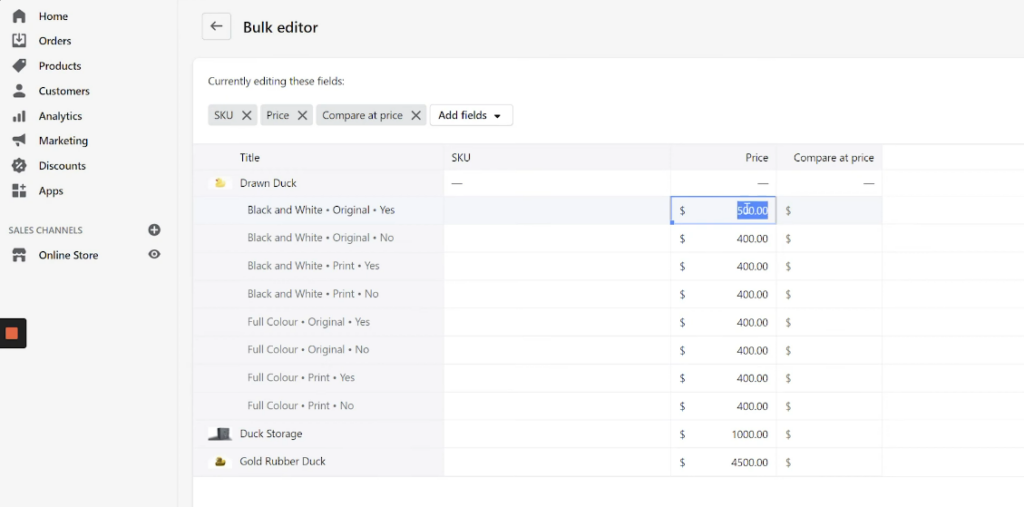
Shopify Analytics provides detailed reports on sales trends. It lets you discover peak sales periods, popular products, and average order values.
The data can provide insights into products that are in high demand during these seasons. The insights will help you strategically adjust pricing for these products during sales, which may increase revenue.
Personalized pricing is another dynamic pricing strategy you can leverage with the help of Shopify analytics. You can set personalized pricing for customers with certain buying behaviors, such as their order value, products they buy, etc.
You can do this by setting pricing rules for different custom groups based on their buying frequency, the products they buy, and more. Using Shopify apps, such as Easify Product Options Variant, Prisync Dynamic Pricing, Intelis AI: Dynamic Pricing, etc., is an easy way to set dynamic pricing on Shopify.
;
These are the roles that Shopify plans to help you build a robust BFCM sales and promotion strategy.
But a question remains—what metrics should you focus on? Let’s check that out next.
Key Metrics to Analyze for Black Friday and Cyber Monday
Your Shopify store’s analytics gives you a lot of data and metrics to analyze.
But are all these metrics important for BFCM? No.
Some metrics are more crucial than others. These metrics can help you understand how you need to formulate your BFCM strategy for this year.
Using key metrics and data from last year’s BFCM strategy can also help you build a data-driven plan for this year.
Let’s examine the seven most vital metrics here.
#1. Sales by traffic source
Customers come to your site through various channels, such as social media, organic traffic, and advertisements, each with distinct buying behavior. Mobile shoppers are on-the-go shoppers with higher chances of abandoning carts. On the other hand, desktop shoppers are more committed to buying.
Learning how visitors from different sources or channels interact with your site—where they go, how they browse, and what products they check—can help you create a focused BFCM strategy.
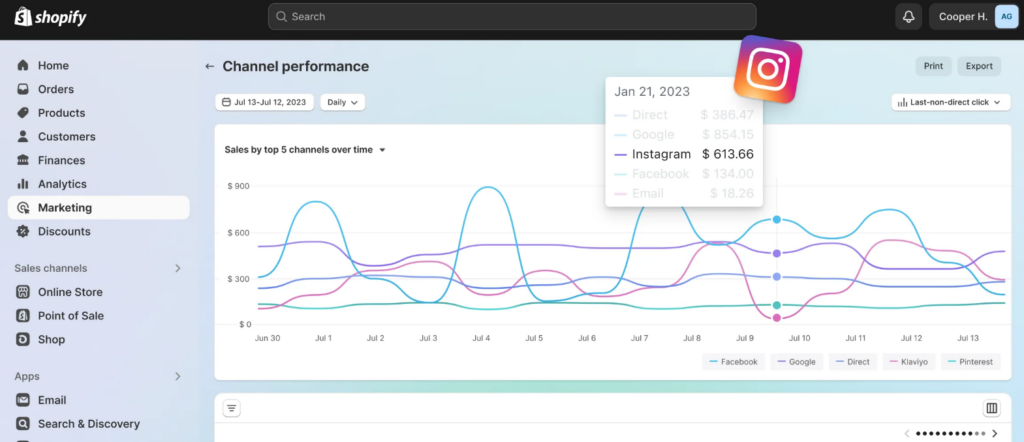
During BFCM, customers are bombarded with promotions from multiple stores and competitors. Hence, focusing on all the platforms without a strategy may just be a waste of time. A smart way, instead, is to spend more on channels that have the highest sales.
To further gain insights into the sales coming from traffic by channels, track the following KPIs.
- Customer acquisition cost by channel: This KPI helps you learn the amount you need to spend on each channel to acquire a customer.
- Conversion rate by the channel: This helps you understand which channel sends you traffic that converts better.
- Bounce rate by channel: It helps you understand which channels have the highest bounce rate so that you can invest less in promotions on such channels.
- Revenue by channel: This KPI allows you to understand which channels offer you the most revenue and returns. With this insight, you can spend more on channels with high revenue while trying to optimize the ones with low revenue.
And understanding these KPIs is crucial for two reasons.
- First, you can understand where the highest converting traffic is coming from.
- Second, where you must invest more to bring in traffic that actually buys from you.
For example, you may get more traffic from social media than other channels. But if the conversion is low, spending more on social media is not the best strategy. On the other hand, if you see search ads bring you more sales despite low traffic, create more search ad campaigns.
#2. Product performance
Not all your products will be top sellers.
Some will be in higher demand during the BFCM, while others may not be.
Understanding the product demand ratio will help you plan your promotional strategy more effectively. It will inform you what products customers want the most and which products have the least demand.
To understand how your products perform well, check the following metrics:
- Units Sold: The number of items sold for each product?
- Revenue Generated: The total sales amount per product?
- Conversion Rate: How often a product view results in a purchase?
- Rate of Returns: How many products are returned by the customers?
Also, filter the data for the time period you want to analyze. Adjust the date range to compare product performance over time by analyzing trends during specific periods like BFCM holidays.
If you already promoted BFCM last year, check the products that performed well. Understand where the traffic came mostly from, the complementary products they bought, and their total cart value.
The product performance analysis also helps you with the following:
— Stock up on popular items.
— Forecast demand accurately.
— Maintain a list of best-selling products.
— Avoid overstocking slow movers during the BFCM season.
You can look at your product performance data for the last 6 months if you have not done any promotions for BFCM last year to discover the products in most demand. And using the insights from these products, formulate the strategy for this year’s BFCM.
The insights from the analysis will be useful when creating promotional strategies and ad campaigns and working with influencers as BFCM approaches.
#3. Sessions by device
Customers shop across different devices. Some prefer to buy on their mobile phones, while others browse and buy on computers and tablets. And, like in the case of traffic channels, customers behave uniquely on each of these devices.
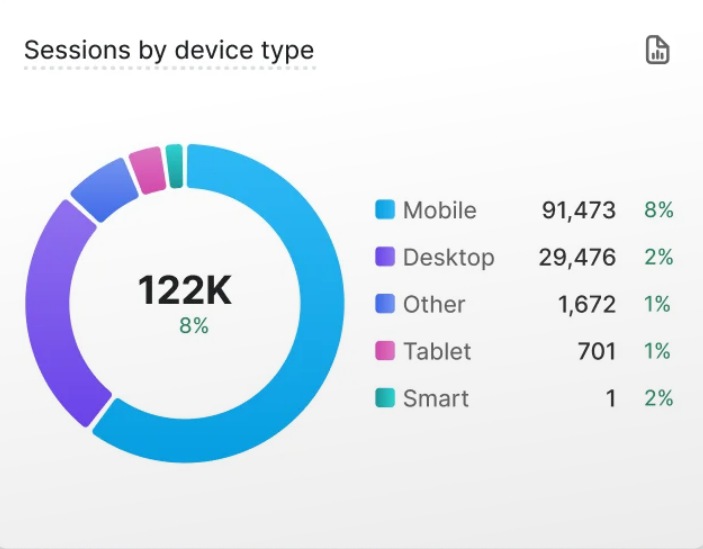
Here is the dashboard on Shopify Analytics showing Sessions by device.
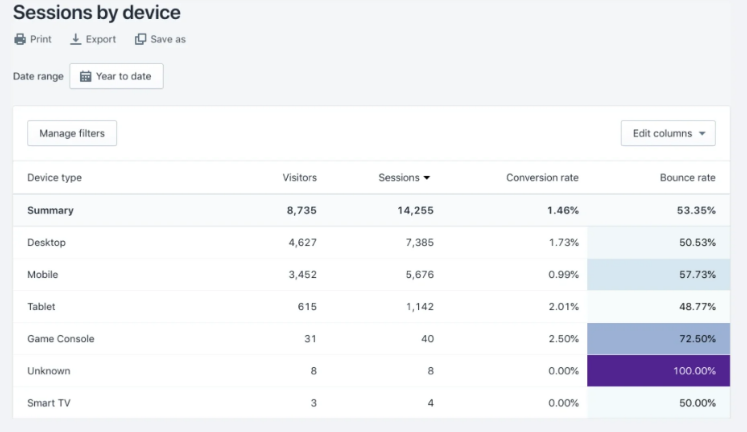
Understanding where your users come from is crucial to planning your sales and marketing strategy. When you understand how people behave on each device—whether they are converting, bouncing, or abandoning a cart—you can plan your strategy accordingly.
Spending more on mobile campaigns is the way to ensure more sales. Understanding the sessions based on the device type help you with the following:
- Optimize mobile performance to improve user experience and conversions.
- Understand cart abandonment rate based on device and fix issues.
- Pick device-friendly payment options, like Apple Pay for mobile users, and credit cards for desktop.
- Plan advertisements specifically for mobile devices and desktops.
Tapcart reports that 81% of customers plan to use mobile apps for shopping in BFCM 2024. And if the majority of your converting traffic comes from mobile, there’s no point in dividing your marketing budget equally between mobile and desktop.
#4. Average Order Value (AOV)
Average Order Value tells you how much a visitor spends on average on your store per transaction. You can get this number by dividing the total revenue by the number of orders.
It is also possible to explore this metric further. You can calculate AOV for customers, devices, sales channels, and campaigns. Comparing the AOV under each of these categories can offer invaluable insights that can help improve your BFCM marketing efforts.
This is particularly important when formulating your BFCM sales strategy. It allows you to compare the AOV with orders having a higher value than the AOV and shows patterns in such orders—the products these users bought together, where they come from, what device they use, etc.
Another way to use the insights is to improve the AOV. You can offer free and faster shipping after a certain order value, offer additional discounts, or give exclusive access.
As urgency is a huge factor during times like BFCM, these strategies can help improve your revenue considerably.
#5. Site speed and performance
People are eager to browse products fast. They want to buy and use them as quickly as possible. Trust us; no one likes to browse an online store that takes forever to load.
Nearly half of your visitors will leave if your store takes over 3 seconds to load. They will go to your competition, who may have a faster-loading store.
A slow site will also affect your conversion rate, as customers are less likely to buy from a slow website.
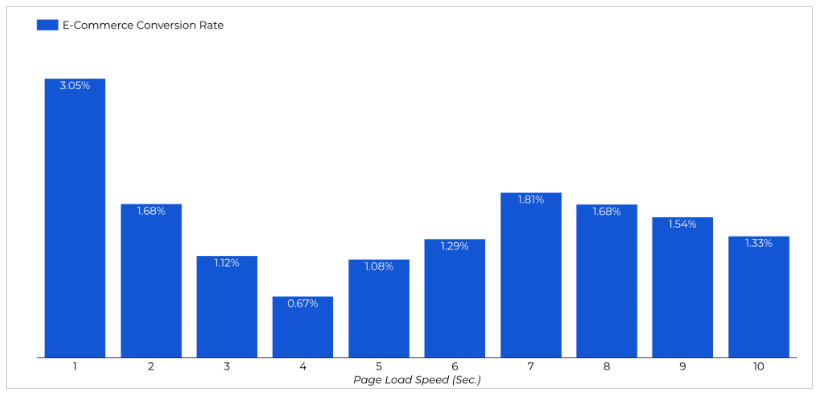
Tracking your store’s speed is vital to ensure a seamless shopping experience for your customers.
Here are a few KPIs that you can track to understand your site’s speed and performance.
- Page Load Time: This KPI tells you how long it takes for your site to load fully. Load time is vital for user experience and conversions, especially during high-traffic events like BFCM.
- Time to First Byte (TTFB): TTFB shows your server’s speed when responding to a user request. A low TTFB ensures faster loading and better performance under high traffic.
- First Contentful Paint (FCP): FCP tells you the time the first piece of content appears on the screen. A faster FCP ensures quick engagement by your users.
- Bounce Rate: The bounce rate tells the number of people leaving your site immediately after landing on a page. High bounce rates can indicate slow site speed. It can really hurt your site, especially during events like BFCM.
- Server Response Time: Server Response time is how long your server takes to handle user commands. This KPI is crucial to track the speed, especially during high-traffic times like BFCM.
Work with a tool like Google’s PageSpeed Insights to understand exactly where your site is lacking in speed and performance.
#6. Traffic and engagement
Everything you do in your capacity before the BFCM kicks off is to bring traffic to your site. And believe us, getting traffic is just not enough.
What you really want is engagement—clicks, shares, and sales.
Higher traffic and engagement mean better conversion opportunities. The more people visit your site and interact with your content, the greater the chances of sales. So, that’s another necessary metric for you to track.
But how do you track them?
Here are a few ways to track traffic and engagement on your Shopify store during the BFCM sales:
- Track key engagement metrics, such as Sessions, Pageviews, Bounce Rate, Conversion Rates, etc., on Shopify Analytics.
- Analyze your store’s visitor numbers, traffic sources, and customer activity with the help of the Shopify Analytics dashboard to understand your store’s performance.
- Install third-party apps that can visualize data and provide you with heatmaps, session recordings, and user feedback.
Tracking your traffic and engagement tells you how well you fare in the crowded BFCM marketplace. Moreover, you can also learn where you are falling behind and make real-time adjustments to improve your store’s performance.
#7. Cart abandonment rate
Abandoned carts are a huge challenge for Shopify merchants. Bringing customers to the site only to have them abandon their carts hurts Shopify store owners the most.
Here are a few reasons for customers leaving your carts.
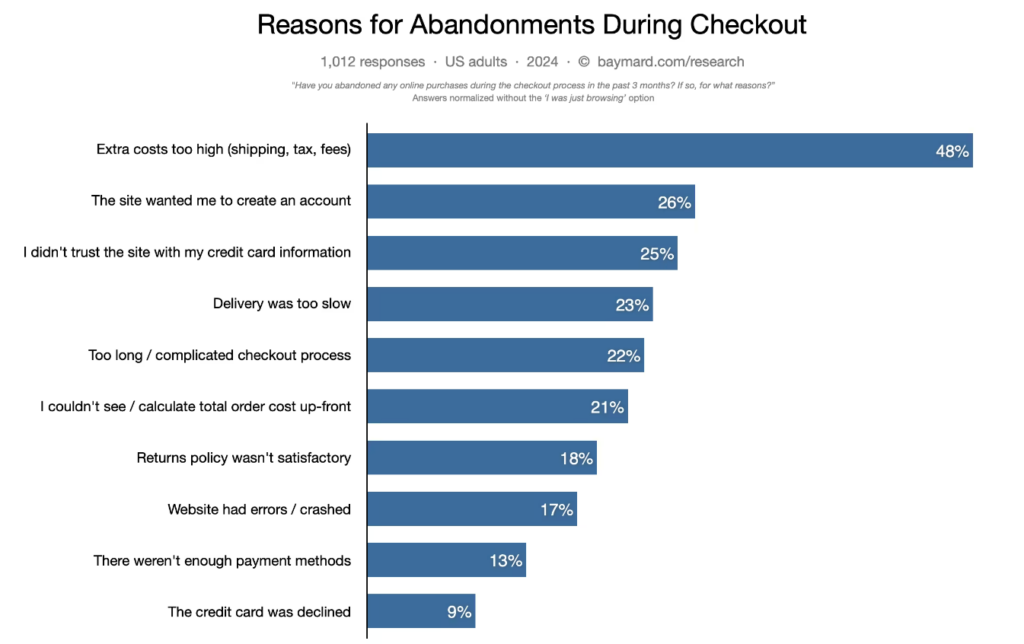
However, it need not be a bad thing. Cart abandonment rate is a powerful metric that can tell you a lot of things. People abandoning your cart just before buying can indicate that there is something wrong with your checkout page.
Using Shopify Analytics, you can get deeper insights into the cart abandonment rate.
When planning your BFCM sales promotions strategy, here are a few KPIs that you can track on Shopify Analytics to reduce cart abandonment.
- Cart abandonment rate by channel: This shows you where the traffic with the highest cart abandonment rate comes from, allowing you to adjust your campaigns accordingly.
- Checkout abandonment rate: This KPI helps you identify people who start the checkout process but do not complete it. It is a direct indication that there’s an issue with your checkout page. Fix this before the BFCM to reduce the cart abandonment rate.
- Cart abandonment rate by device: This KPI helps you understand the device that the traffic with the highest cart abandonment rate is using and optimize your checkout page for that particular device.
One or more of these can drive up your store’s cart abandonment rate. Analyze your checkout page for any of the issues given above. Since urgency is a key factor during the BFCM sales, you must ensure that the checkout process is quick and easy.
There are several things you can do to reduce the time on the checkout page, such as:
- Remove unnecessary data fields.
- Allow guest checkouts at your store.
- Enable autofill data from the user’s account.
- Display secure checkout logos and trust badges.
- Add payment methods, like Apple Pay, Google Pay, etc.
Lowering your cart abandonment rate can increase your sales, as it ensures potential buyers follow through with their purchases. Offering incentives like free shipping or one-click checkout can make a big difference during BFCM.
All these metrics offer deep insights into your store’s performance.
Now is our time to understand how you use Shopify analytics to optimize your BFCM strategy. Let’s explore that now.
How to Use Shopify Analytics to Optimize Your BFCM Strategy
Creating your BFCM strategy is only one side of the coin. You need to optimize the same based on unique data-backed insights. As a Shopify merchant, you have a built-in tool to help you with this—Shopify Analytics.
With the help of Shopify Analytics, you can understand effective and non-effective elements of your strategy.
Depending on those insights, you can make informed decisions about investing. However, this is only possible when you know how to use the Shopify Analytics tool correctly.
In this section, we are learning key ways of using Shopify Analytics that help you optimize your BFCM strategy.
Let’s start.
#1. Monitor real-time analytics with Live View
Leverage Shopify’s Live View feature to monitor real-time customer behavior during BFCM. Live View provides insights into three major factors:
—How many visitors are on your site?
—Where are your visitors located?
—How are they interacting with your store?
The tool allows you to observe metrics such as total visits, orders, and sales as they happen. Wondering how that helps you? It allows you to identify trends and patterns in your visitors’ behavior quickly. And you can make informed decisions about campaigns and ads, as the sales happen.
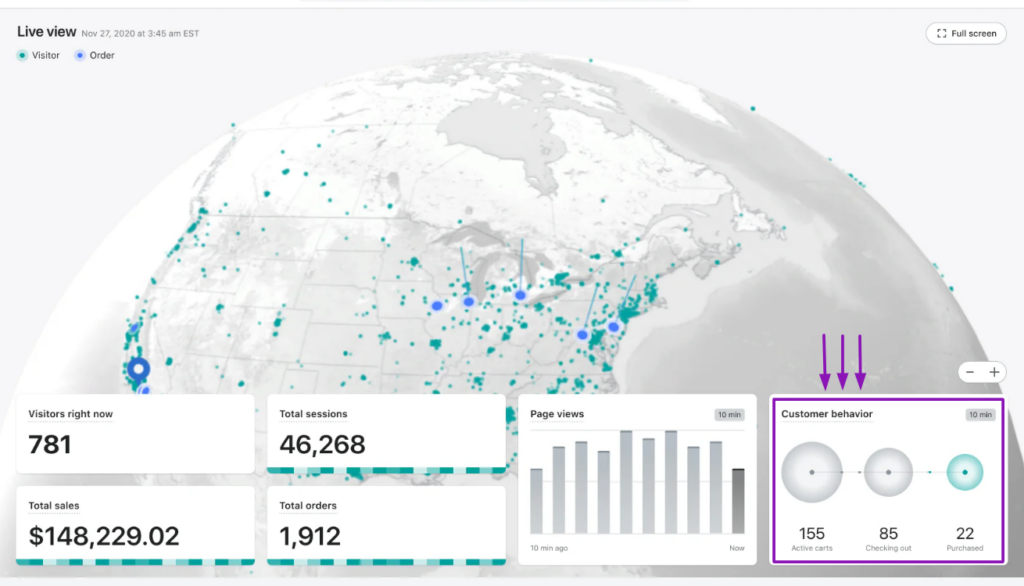
While Live View can be used for various purposes, here are three crucial steps to effectively use it during the BFCM sales.
1. Track visitor behavior
Observe the products being added to carts and analyze the number of visitors going through the checkout process. These insights help you monitor the promotions and check if they resonate with them.
This allows you to make real-time adjustments to your campaign while the BFCM is running.
2. Adjust marketing strategies
Shopify Live View allows you to understand the traffic coming to your site in real-time. If you observe a spike in traffic from a specific source, you can assign more marketing resources to capitalize on the situation. You can also do the same for products or marketing channels
For example, if you see higher demand for shoes by traffic from Instagram or TikTok, run more ads on these platforms to increase sales.
3. Identify bottlenecks in real-time.
Monitor the checkout process in real-time to identify potential issues causing cart abandonment. If you see many visitors dropping off at a certain stage, analyze and resolve the issue quickly to improve conversion.
For instance, if you see customers dropping off at the checkout page, use Live View to determine what’s causing the issue in real time. Or you may lose converting customers.
#2. Analyze historical data for trend insights
Before the BFCM rush catches up, take the time to explore your Shopify Analytics by reviewing historical sales data. The data could be from your past year’s BFCM sales, other sales events, or even regular sales history. This will work greatly if your product portfolio has remained largely similar.
Historical data analysis helps you with the following elements.
—Identifying popular products over the years.
—Understanding how customers behave on your site.
—Finding the most effective sales strategies in the past BFCM events.
Here are a few actionable ways to use Shopify Analytics to optimize your BFCM sales strategy.
1. Identify sales trends.
Examine your sales during the BFCM period in the last few years. Check different reports for the period such as total revenue, number of orders, and AOV.
It provides you with a lot of insights about trends given below:
- Which items were selling well and which were not selling?
- Understand frequently purchased product combinations.
- Discover buying patterns and repeat purchase rates in your store.
This will help you learn what your customers want the most and determine which items to promote heavily during this BFCM. Consider bundling these popular items or offering discounts to encourage more purchases.
2. Carry out seasonal demand analysis
Shopify Analytics helps you carry out seasonal demand analysis based on your historical data. It could be based on previous BFCM events or other sales events.
The analysis helps you understand the following details.
- How different product categories perform during BFCM.
- What products have unusual demand during the BFCM sales.
- Page views and add-to-cart rates for various products or collections.
All these tell you what your customers are most interested in during the BFCM sale and help you refine your promotional and inventory strategies.
3. Evaluate your marketing strategies
Looking at your historical data on Shopify Analytics can also tell you how effective each of your promotional campaigns was for diverse sales seasons, including BFCM.
Review the marketing channels that brought you the most traffic. Assessing your marketing strategies helps you understand the following.
- What channels brought the most traffic?
- How well the traffic from each channel converted?
- How different promotions, like discounts, free shipping, etc., worked?
The trend analysis helps you determine the promotional strategies that resonate best with your audience. And you can use similar strategies for this year to improve overall sales.
#3. Create customer segments for targeted BFCM marketing.
Shopify Analytics allows you to segment your customers based on their purchase behavior, location, or lifetime value. Each segment can offer you deep insights into your customers.
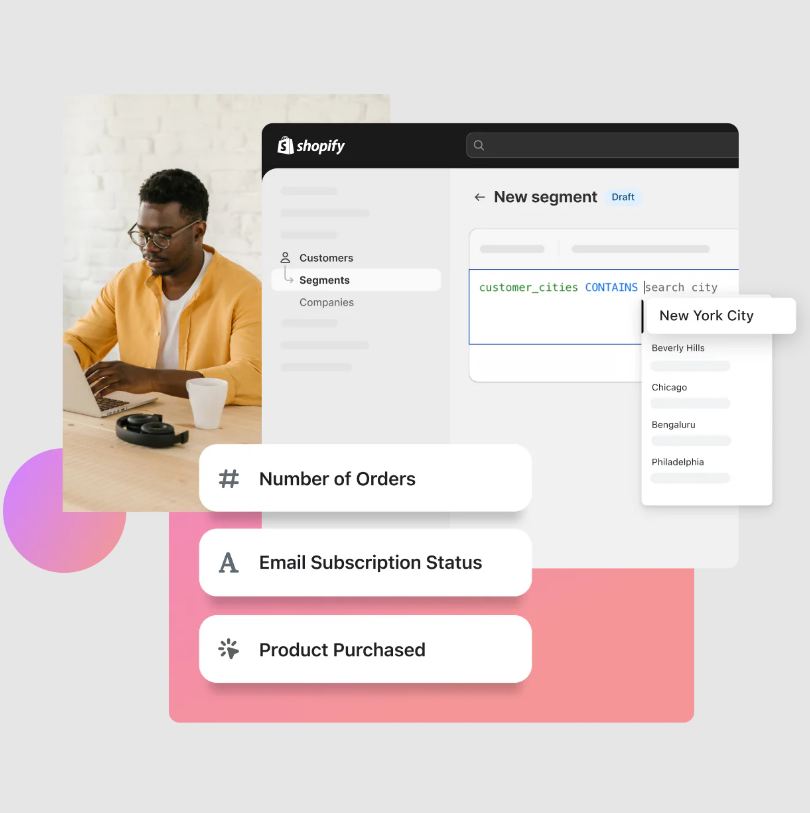
Segmentation helps you understand the following elements.
—Which customers are more valuable to your brand over time?
—How often and how recently different customer segments buy?
—How do groups respond to certain channels—email, paid ads, etc?
You can use these insights to create personalized, high-impact marketing campaigns for BFCM that meet the unique traits of each segment. This ensures that your messages work with different groups of customers and will lead to higher conversion and revenue.
Use the following actionable tips to use for customer segmentation in Shopify Analytics.
1. Behavioral segmentation
Use analytics to segment customers based on their behavior on your site. Some vital criteria to use are items viewed, products added to the cart, or abandoned carts. It helps you align the sales strategy and messaging to the behavior of that segment.
For example, you can set up reminder emails for customers who abandon their carts and offer discounts on the products in the cart to encourage conversions.
2. Demographic targeting
Segment your audience by demographics such as age, marital status, gender, and location. This data can help you craft specific promotions that appeal to different groups.
For example, if you notice a major part of your audience is young adults, promote trendy items that align with their interests.
3. Personalize email campaigns
Use segmented lists to create personalized email campaigns. Address your customers by name and recommend products based on their browsing history. This will make your emails more appealing to your customers.
Remember that personalized emails have higher open, click-through, and conversion rates.
#4 – Explore product insights and optimize product offerings
Getting people to your online store is just the beginning. You need to make them stay and buy from you, and the best way to do this is to optimize your product offerings.
With Shopify Analytics, you can discover what products your customers are buying the most and what types of customers (age, location, interests, etc) are buying from you.
Here is how to find the most popular products by sales in your store.
- Log in to your Shopify admin.
- Navigate to Analytics > Reports.
- Pick Categories and click Sales.
- Choose Sales by product.
This will show you the best-selling products in your store.
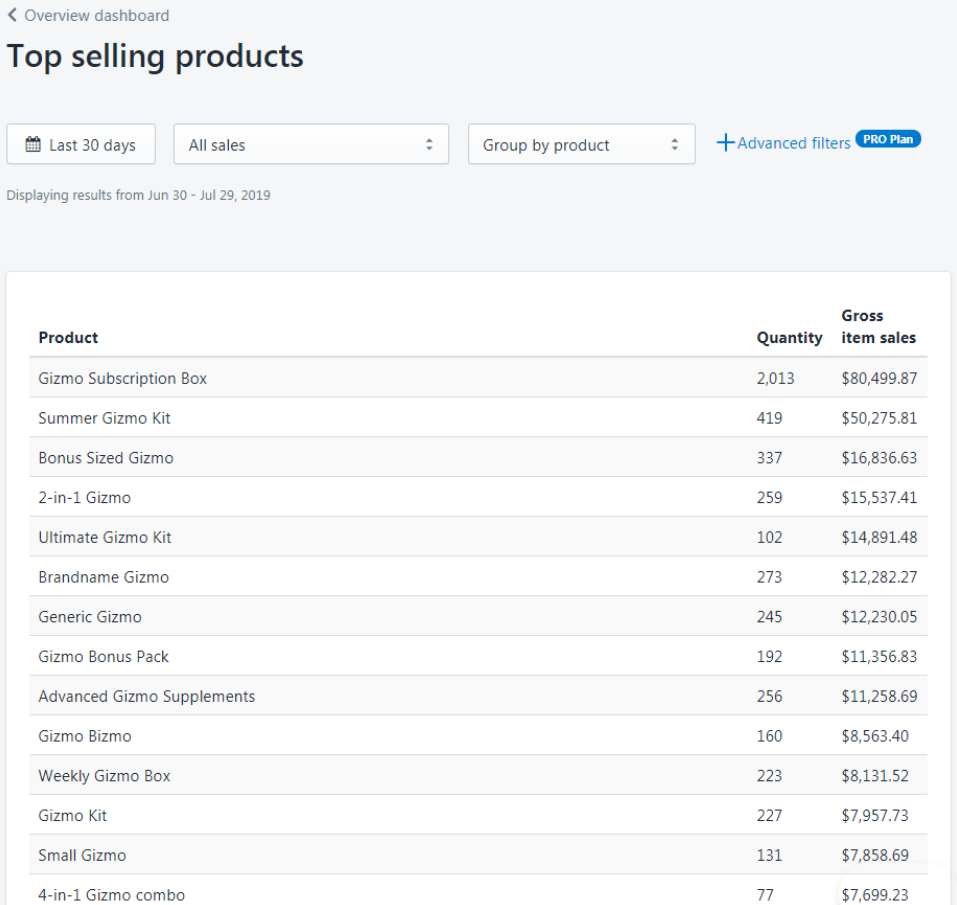
When you get access to that information, you get to plan over multiple areas, such as:
- Upsell & cross-sell products
- Give personalized, tiered discounts
- Interactive discounts with flywheels
1. Upsell and cross-sell
Analyze your product catalog and identify items that complement each other during Shopify BFCM for upsells and cross-sells. Look at previous sales to see the products that your customers bought together. Then bundle the products that are bought together the most. Consider even offering a discount for the bundle to increase the average order value.
For example, you can bundle a cloud storage subscription with a laptop. To take it up a notch, you can offer tiered options, like 30 GB, 70 GB, 125 GB, etc., to appeal to customers with different storage needs.
Offering higher-priced versions of the same product at the checkout page is another smart upselling way to improve your revenue.
For example, when a customer buys an iPhone 16 with 256 GB storage, try offering the 512 or 1 GB version with a better discount.
2. Personalized discounts
Personalized discounts are great to optimize your BFCM strategy based on product insights. Shopify Analytics can tell you how much customers buying a particular product are willing to spend based on product sales history.
This allows you to offer tiered discounts to customers to increase the average cart value. For example, you can offer 10% for sales over $80, 15% for sales over $150, and 20% for sales over $250. Adding options like zero-cost EMI, Buy Now Pay Later, etc., can also improve revenue.
You can also offer product-specific discounts to improve sales and revenue. You can do this by finding products performing below expectations from Shopify Analytics and adding category-wide discounts to boost sales.
3. Interactive discounts
Make customers interact with your site on certain product categories. Get the customer behavior data from previous sales events to see who responds to such discounts. You can also discover insights about these customers, such as where they come from, their AOV, conversion rate, etc.
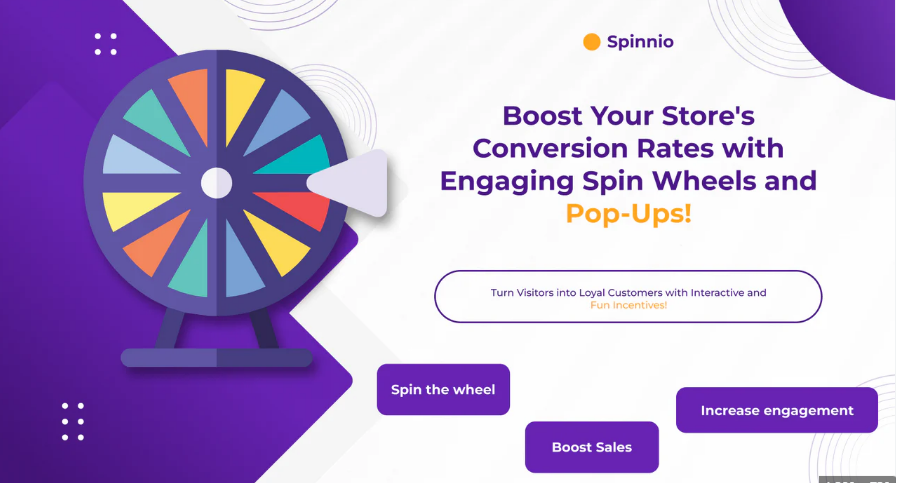
With this data, you can offer a customized virtual spinning wheel where they can win subscriptions, discounts, and products.
You can also optimize the wheels based on customer preferences, browsing history, purchase behavior, etc.
You can also offer referral programs to your visitors where both the referred and referrer customers can get discounts during the BFCM sales season.
#5 – Improve user experience and site performance
PR Newswire says 60% leave ecommerce stores due to poor customer experience. It is a huge number. Optimizing your site for easy consumption is crucial during high-traffic events like BFCM. Using Shopify Analytics, you can understand where your site is under performing and needs improvement.
This is where Shopify analytics can help you.
1. Identify high-traffic pages, categories, and collections pages
Optimizing your entire site may not be possible before the BFCM season hits the door. You need to be strategic about it. Hence, use Shopify Analytics to discover pages that receive the most traffic. Apart from product pages, you also need to look at category pages, collections, and even your checkout page.
Now test them for speed and performance. To check the speed of the pages, you can use tools like PageSpeed Insights.
Evaluate the quality of images, videos, and other multimedia elements on these pages. If necessary, replace low-quality images or videos with high-quality ones. Compress images without losing quality to reduce the page size and speed up loading times.
Use these insights to bundle products more efficiently for higher cart value and reduce cart abandonment rate during the 2024 BFCM sales season.
2. Monitor key UX metrics
Use Shopify Analytics to monitor key UX metrics that indicate how long customers interact with your store and stay on it. Knowing this helps you address these challenges and the effectiveness of your sales strategy during BFCM.
Here are a few key UX metrics to track on Shopify Analytics.
- Pageviews
- Bounce rate
- Conversion rate
- Unique pageviews
- Average time on page
Based on these key metrics, you can optimize the BFCM strategy. For example, a higher bounce rate on a page indicates that something is wrong with the page. You can compare the page with a high-converting page to see why.
This analysis allows you to adjust the navigation, add clear CTAs, improve the content, and enhance other elements for a better user experience.
3. Mobile optimization
YouGov says that 45% of customers use their mobile phones to purchase online. That means nearly half of your customers come from mobile phones. Failing to optimize your store for mobile users is a huge mistake.
As a Shopify merchant, optimizing your store for mobile performance is crucial during the BFCM season. Shopify analytics can help you do it strategically.
Mobile traffic insights: This helps you understand how your mobile traffic is segmented and how each segment responds to your campaigns or discounts. Based on these insights, you can then optimize your BFCM strategy to complement the mobile traffic and its behavior.
For example, if New Mothers is a segment with high mobile traffic, create mobile campaigns to sell newborn baby products.
Mobile conversion rate: This tells you how well your mobile traffic is converting. You can go deeper into the analytics to see what products, categories, or collections convert better and what do not.
With these insights, create campaigns for those categories or collections with higher conversion rates. This will improve your BFCM strategy’s effectiveness.
Customer journey: Customer journey explains how mobile visitors navigate your store with customer journey. It helps you figure out friction points in your store and where the customers drop off. It could be due to UX elements, navigational issues, etc.
Find and address these issues to ensure better sales during not just the BFCM season but also in the future. You can also create retargeting ads to bring them back if the products are high-value and have a high conversion rate.
With these insights, you can improve your BFCM sales strategy and get ready for an exciting holiday season come BFCM 2024.
Conclusion
Black Friday and Cyber Monday are just a few weeks away.
Planning ahead of the holidays allows you to figure out your marketing and sales strategy as a Shopify merchant. Creating an intelligent marketing and sales strategy requires a lot of homework and analysis.
And Shopify analytics is your biggest ally in this battle.
Shopify analytics offers deep insights into what is working and how you can formulate your strategy based on user behavior, product performance, and the industry trends for the 2024 BFCM season and what metrics you need to focus on.
While working on your strategy yourself is welcome, having an expert team to help can guarantee success. And if you are looking to hire a Shopify performance optimization agency, Aureate Labs is a great option.
With an extensive team, deep Shopify expertise, and custom service plans, we can prime your store for huge success at the 2024 Black Friday and Cyber Monday.
Speak to us for a free consultation.


Post a Comment
Got a question? Have a feedback? Please feel free to leave your ideas, opinions, and questions in the comments section of our post! ❤️