As developers we know how an extra 15 mins could help us in cross-checking the work and improve if something is lacking. Not every developer has those extra 15 minutes, but you can make room for them by picking up the pace and using Magento 2 frontend tools for developers that are already built into your workflow. That’s how you keep things tight, efficient, and moving forward without stress.
The blog is important for all the Magento developers who want to speed up Magento 2 frontend development using Chrome extensions.
Why should we use Chrome extensions for Magento 2 Frontend Development?
- Do you have an issue with the finding template/block without enabling a template hint?
- Taking time while theme development/customization for finding a correct block/layout/phtml?
- Having difficulties identifying which queries are executed on a particular page?
- Do you want to increase the theme development speed?
Available Chrome extensions
I have checked the various available extensions to speed up Magento 2 frontend development. I have found the best 2 extensions, which I have mentioned below. You can use any of them. Mage chrome toolbar by Magespecialist
Mage chrome toolbar by Magespecialist
- https://github.com/magespecialist/mage-chrome-toolbar
- https://github.com/magespecialist/m2-MSP_DevTools
JH Block Logger
Above, both extensions have their own benefit,s but it depends on your requirement. Both tools are very easy to install & use.
Benefits
- It allows you to quickly access the information you need to debug your Magento performances, to build your new theme, or to modify an existing one.
- Easy and fast access to observers, profilers, and theme information.
- Help to identify phtml/layout/block for an element.
- Help to identify locale, theme & stack.
- Get information about which queries are executed on the page and how much time taken by each query.
- All this information are available with one click after one-time setup & configuration.
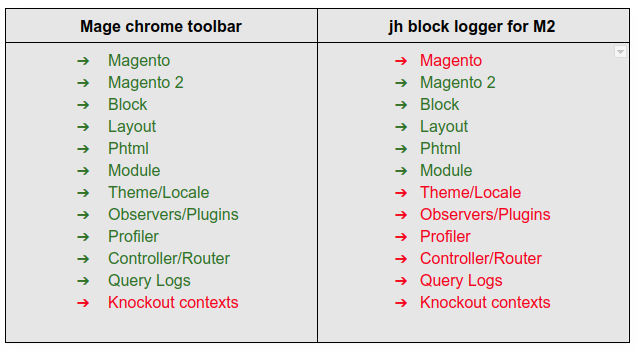
Comparison

Features of Mage chrome toolbar
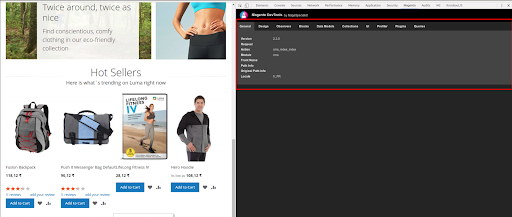
Global Page Information
From the main panel you can see information from:
- Theme
- Controller / Router
- Request parameters
- Layout and Layout updates
- Observers
- Data Models inspector
- Collections inspector
- Blocks, Containers, uiComponents
- Profiler
Item Information
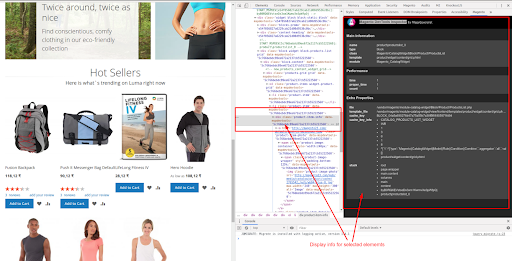
By selecting an item on your page, you can see:
- Block information
- Used template
- Server elapsed time
- Block nesting
- Template file
- Cache information
- uiComponent information
- Container information
Mage Chrome toolbar’s installation & configuration
- Go to the project root directory in the CLI and run the following command
- composer require msp/devtools
- Now execute the command below to update the database
- php bin/magento setup: upgrade
- php bin/magento setup: upgrade
- Turn off full-page caching while using this tool.
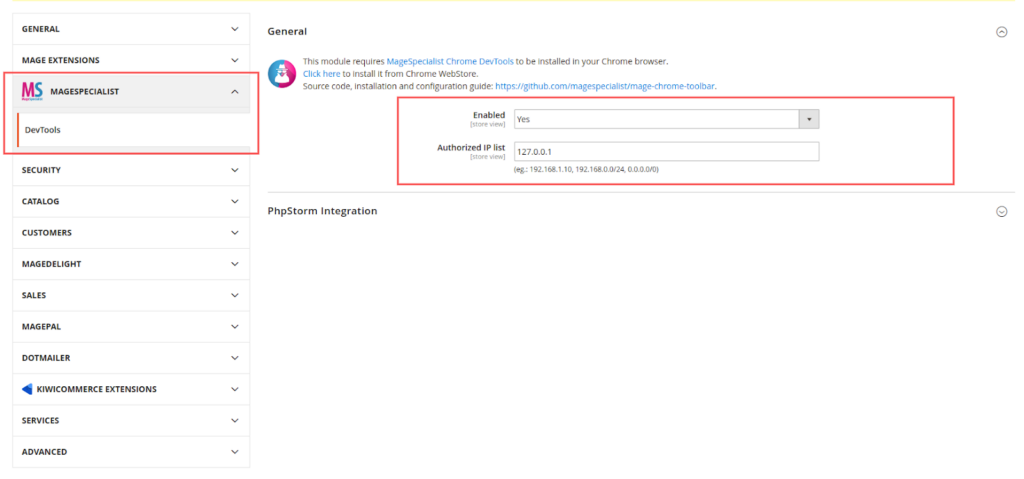
- Open Magento backend and go to Stores > Settings > Configuration > MageSpecialist > DevTools
- Enable the devtools and set IP restrictions (This extension works on restricted IPs only)
- To enable Profiler to do the following.
- Add line below to pub/index.php
$_SERVER['MAGE_PROFILER'] = [
     'drivers' => [
          [
      'output'=>'MSP\DevTools\Profiler\Driver\Standard\Output\DevTools'
      ]
   ]
];- Or you can add a line below to .htaccess
SetEnv MAGE_PROFILER MSP\DevTools\Profiler\Driver\Standard\Output\DevTools- Now, install Chrome extension from link below
https://chrome.google.com/webstore/detail/magespecialist-devtools-f/odbnbnenehdodpnebgldhhmicbnlmapj
That’s it installation & configuration is done. I had followed some basic and simple steps to use tools. Now, let’s check some screens of this tool which I had taken it from my instance.


Special thanks to @wearejh & @magespecialist for providing such nice tools to Magento Developers.
Using Magento 2 frontend tools for developers is an easy way to boost your speed without cutting corners. These Chrome extensions simplify template checks, layout tracing, query insights, and overall theme workflow.
They keep things clean, fast, and aligned with how devs have always handled frontend tasks. If you want to tighten your process and save those extra minutes, these tools get the job done with zero drama.
I hope this blog will help you with frontend development. Let me know your thoughts in the comments section. And if you have any queries about this blog, I will be happy to solve them. Thanks and cheers … 🙂


Post a Comment
Got a question? Have a feedback? Please feel free to leave your ideas, opinions, and questions in the comments section of our post! ❤️