Unlock Better Google Ads Results for D2C Brands in 2026

Getting better Google Ads results isn’t about spending more. It’s about reading the data correctly and acting on the right signals. Over 96% of brands invest in Google Ads, yet most D2C teams still struggle to connect in-platform metrics to actual revenue (Demandsage).
If you’re running paid ads but not seeing consistent returns, it may be worth reviewing how your broader eCommerce growth strategy is set up before optimizing individual campaigns.
Businesses earn an average of $2 for every $1 spent on Google Ads, but that average hides a wide gap between brands running disciplined accounts and those burning budget on traffic that never converts (Wearetenet).
A campaign can generate traffic and still hurt margin. A product ad can post a strong click-through rate and still send the wrong shoppers to the wrong page. A bidding strategy can look smart in-platform while starving the account of the conversion signals it needs to improve.
Google Ads works when the feedback loop is tight. Measure the right signals. Read them in context. Find the bottleneck. Change one variable at a time. Then, validate the business impact on revenue, not just in-platform efficiency. That’s exactly what this guide will walk you through.
Key Takeaways
- ROAS alone doesn’t tell you if a campaign is profitable. Read it alongside margin, CPA, and impression share.
- Most Google Ads problems aren’t bidding problems. They’re tracking, targeting, or landing page problems.
- The Search Terms Report reveals more wasted spend than any automated Google recommendation will.
- Bad conversion tracking doesn’t just hurt reporting. It teaches the algorithm to optimize toward the wrong goal.
- Fix one lever at a time: bidding, creative, targeting, or landing page. Not all four at once.
Why Most D2C Teams Read Their Results Wrong
A familiar scenario plays out every week inside eCommerce teams. Spend is up, traffic is flowing, branded search looks healthy, and someone asks the only question that matters: “Are these Google Ads results actually good?”
That question usually comes too late. By the time the team starts digging, the budget has already leaked into weak search terms, product pages with poor message match, or campaigns that look fine on last-click reporting but don’t hold up when you check order quality and repeat purchase behavior.
For D2C brands, what matters most isn’t raw activity. It’s predictable demand capture. That lets you plan inventory, budget by product line, and scale without guessing which channel will collapse next month. It also changes how you should read the dashboard.
A campaign isn’t “working” because it gets clicks. It’s working when it consistently captures intent from Google search results and turns that intent into profitable orders.
Google Ads operates on a pay-per-click (PPC) model, meaning advertisers pay each time a user clicks on their ad, and costs can vary significantly based on competition for keywords. That’s exactly why sending the wrong traffic to the wrong page isn’t just a conversion problem. It’s a cost problem.
What Good Operators Do Differently
Strong teams don’t stare at the overview tab and hope patterns appear. They ask sharper questions:
- Where is intent strongest? Which campaigns bring potential customers closest to purchase, not just to the site?
- Where does the funnel break? Are weak results caused by bidding, ad relevance, product pricing, or the landing page?
- Which metrics deserve action? Which signals should change budget allocation today, and which are only context?
Google Ads becomes easier to manage once you stop treating every metric as equally important. Your dashboard is a diagnostic tool, not a scorecard.
The Metrics That Actually Tell You Something
The fastest way to misread Google Ads results is to focus on one metric in isolation. A high ROAS can hide weak new-customer growth. A strong CTR can mask poor traffic quality. A low acquisition cost can look great until you realize those customers buy once and never return.
Some gauges tell you how fast you’re moving. Others tell you whether the engine is healthy. You need both.
The KPIs That Actually Matter
ROAS is the first number most eCommerce teams check, and that’s fine. It tells you how much revenue the platform attributes to your ad spend. But ROAS only becomes useful when you compare it against margin, average order value, and whether the Google Ads campaign is driving new customers or just harvesting branded demand.
CVR (conversion rate) is where traffic quality meets on-site performance. If people click and don’t buy, either your offer doesn’t match the query, or the product page isn’t doing enough to close the sale.
The average conversion rate across industries is 6.96%, and the average CTR is 6.42% (Digital Silk). These numbers are a reality check, not a target. Your own history matters more.
Cost Per Acquisition (CPA) is the average cost to land one conversion. It matters when you’re trying to grow without wrecking payback. A campaign can deliver acceptable ROAS and still bring in customers too expensively if repeat purchase behavior is weak.
If your paid traffic is converting but not repeating, that’s often a retention problem, not an ads problem. Good Google Ads agencies look at both acquisition and post-purchase quality together.
Impression share tells a different story. It doesn’t measure profitability directly. It tells you whether you’re even showing up often enough in auctions that matter. If a high-converting campaign is constrained, your problem may be budget, bids, or ad rank, not demand.
Read KPIs as a System
| Metric | 2026 Benchmark | What It Tells You |
| Search Ads CTR | 3.17% | How your Google search ads specifically perform relative to a broader benchmark. |
| Display CTR | 0.46% | Whether display placements are attracting engagement. |
| Average Conversion Rate | 4.40% | The efficiency of paid traffic in turning into leads or purchases. |
| Average Cost Per Lead | $70.11 | Whether acquisition costs are stabilizing or rising compared to previous years. |
A good dashboard read sounds like this: CTR is healthy, so the ad is relevant. CVR is weak, so the landing page or offer likely needs work. Impression share is low in top-performing ad groups, so the budget should move there before we expand keywords.
A bad dashboard read sounds like this: ROAS is down, so pause the campaign.
What Each KPI Should Trigger
- High CTR, low CVR: Check product page speed, message match, pricing clarity, shipping details, and checkout friction.
- Low CTR, decent CVR: The page may convert qualified traffic, but the ad copy or keyword targeting isn’t pulling enough of the right shoppers in.
- Strong ROAS, low scale: Look at impression share and search coverage before declaring victory.
- Rising CPA with stable CTR: Competition, product-market mismatch, or weaker post-click experience may be reducing efficiency.
Practical rule: Never make a budget decision from a single KPI. Pair every efficiency metric with a traffic-quality metric and a post-click metric.
Where to Look When the Dashboard Isn’t Enough
The main dashboard is where people check campaign performance. The reports are where they find insights.

Most wasted spend in eCommerce doesn’t come from obvious mistakes. It comes from small pockets of irrelevance that pile up: broad queries that shouldn’t have matched, competitor overlap you didn’t notice, product pages that pull clicks but don’t close. Those issues rarely show up clearly in the top-level campaign view.
1. Search Terms Report
If you’re spending aggressively, the Search Terms Report should be part of a weekly operating rhythm. It shows the queries shoppers typed before clicking through Google paid search results to your page. That matters because keyword lists only tell you what you intended to target. Search terms tell you what you actually paid for.
Regularly working through this report and adding negative keywords is one of the highest-leverage optimization tasks in any account. What to look for:
- Irrelevant intent: Queries that are informational when you need transactional intent.
- Low-fit modifiers: Terms like “cheap,” “free,” “replacement,” “tutorial,” or “review” when your offer doesn’t fit that buyer stage.
- Product mismatches: Searches landing on broad collection pages when a tighter product page would serve better.
- Hidden winners: Queries converting well enough to deserve their own exact or phrase match ad group.
When a search term keeps appearing and doesn’t convert, add the negative, isolate the spend, and move on.

Pro Tip: Export your Search Terms Report every Monday and filter for queries with 10+ impressions and zero conversions in the last 14 days. That single filter will surface most of your wasted spend faster than any automated recommendation. If the pattern keeps repeating, the issue likely runs deeper than keywords. Here’s how to diagnose why your Google Ads aren’t converting.
2. Auction Insights and Landing Page Checks
Auction Insights helps answer a different question. Not “Did we get clicks?” but “Where are we winning or losing the auction?” If impression share drops on your best campaigns, check whether competition has become more aggressive or whether your own ad rank has softened.
The landing page report closes the loop. If a product category campaign attracts qualified traffic but fails to convert, the issue often sits after the click. Check whether the page reflects the exact promise made in the ad. A shopper searching for a specific product variant shouldn’t land on a generic category grid.
Weak results often come from poor handoffs, not poor ads.
3. Attribution Changes What You Scale
If you rely only on last-click, branded campaigns will often look like heroes, and prospecting campaigns will look weak. That creates a common failure pattern where teams keep funding the campaigns that close demand and underfund the campaigns that create it.
A better approach is to compare platform data with your store data and your attribution model. Use Google Ads reporting tools for speed and direction. Use your broader analytics stack to validate whether the account is driving incremental revenue.
If your tracking setup isn’t reliable enough to support attribution decisions, Google Tag Manager setup is often the fastest place to start.
Bad Tracking Is Usually the Real Problem
A lot of bad optimization work starts with bad tracking.
Teams change bids, refresh ad copy, split campaigns, and rewrite product page headlines, all while the account is feeding incomplete conversion data back into Google. That creates false confidence. The platform looks active, but the algorithm is learning from partial or delayed signals, and your decisions are built on shaky reporting.
Why Setup Quality Matters
Poor tracking doesn’t just hurt reporting. It hurts delivery. Google’s bidding systems need enough trustworthy conversion data to identify who is likely to buy, what query patterns signal value, and where the daily budget should concentrate.
This isn’t just practitioner advice.
Google’s own documentation recommends at least 30 conversions per month before concluding Smart Bidding, or 50 conversions for Target ROAS to give the algorithm solid ground to optimize. If your store sells products with delayed purchase behavior, phone calls, or cross-device journeys, incomplete tracking can make good campaigns look bad and unstable campaigns look acceptable.
The Tracking Stack That Supports Better Decisions
A clean setup usually includes:
- GA4 linked properly: You need a consistent event flow between site behavior and ad performance.
- Enhanced Conversions enabled: First-party data helps recover signal quality that standard browser-side setups often miss.
- Server-side tagging considered: This improves data reliability and supports privacy-aware measurement.
- Primary conversions chosen carefully: Add-to-cart can be useful for analysis, but often shouldn’t drive campaign optimization if purchase data is available.
This is a real tension many advertisers run into. As a user on Reddit pointed out, optimizing toward top-of-funnel downloads instead of qualified meetings can look efficient in-platform while quietly delivering weaker business outcomes. The same logic applies to eCommerce: training Smart Bidding on add-to-cart events instead of purchases means feeding the algorithm the wrong goal.
Optimizing Google Ads for Highest-Quality Conversion
by u/Available-Interest75 in googleads
- Offline and delayed sales imported when relevant: This matters for hybrid journeys and higher-consideration purchases.
What Breaks Most Often
The most common problems aren’t exotic. Duplicate purchase events. Missing transaction values. Incorrect attribution windows. Check out events firing differently across devices. Consent-related signal loss that no one accounted for after implementation.
Better bidding starts with better inputs. If the platform can’t track metrics tied to actual revenue, it can’t optimize toward revenue clearly. Before you judge Google Ads results, make sure the account is measuring the thing you actually care about.
This is one of the first things the team at Aureate Labs audits when working with a new D2C account. Tracking issues are almost always present, and they’re almost always the reason a seemingly healthy account isn’t producing the revenue numbers the dashboard promises.
Why Google Ads Performance Drops (And How to Diagnose It)
Most performance problems look random when you first spot them. They usually aren’t. They follow patterns.
The trick is to diagnose the symptom before touching settings. If you change bids, creatives, and landing pages at the same time, you won’t know what fixed the issue. Good troubleshooting is slower than panic, but faster than wasting another month of budget.
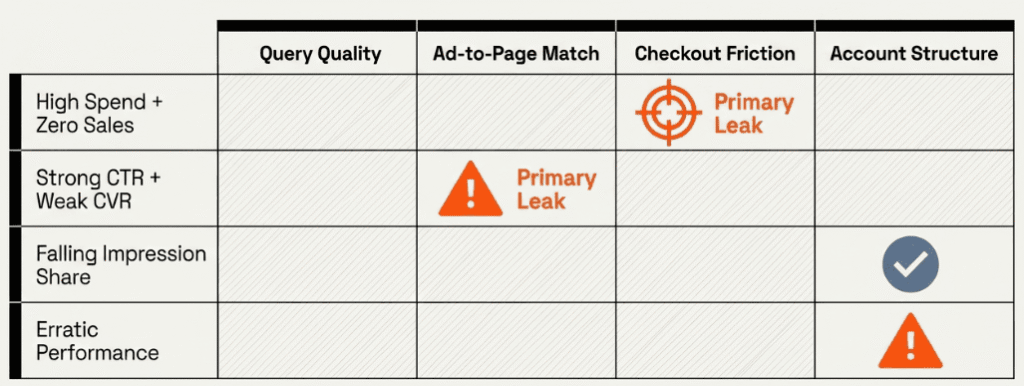
1. High Spend and No Sales
This usually has one of four causes. The traffic is wrong. The offer is weak. The landing page is misaligned. Or tracking is incomplete, and sales aren’t being reported correctly.
Run through this checklist:
- Query quality: Are search terms showing informational or low-intent traffic?
- Ad-to-page match: Does the Ad promise a product, benefit, or price point that the landing page doesn’t immediately support?
- Product page friction: Are shipping, returns, stock availability, and trust signals visible without hunting?
- Checkout path: Are carts being abandoned because the path is too long, too slow, or full of surprises?
If the traffic looks relevant, shift your attention to the page and checkout experience.
2. Strong CTR and Weak Conversion Rate
A healthy CTR means your ad is attractive. It does not mean it’s qualifying the click well.
This pattern often shows up when marketers write broad, benefit-heavy copy that wins the click but doesn’t narrow intent enough. It also happens when a search campaign lands visitors on category pages that are too broad for the specific query. A user searching for a specific product size or color shouldn’t arrive at a generic collection page with no clear path forward.
Ask: Did the ad overpromise? Is the page too generic? Is mobile friction obvious?
3. Falling Impression Share on Profitable Campaigns
Don’t assume demand dropped. Check whether your budget is constrained, whether your bids are too defensive, or whether ad relevance has slipped because the search mix changed.
The root cause can also sit outside the ad account. A broken product feed, a product going out of stock, or a site change can lower performance and make campaigns less competitive. Check product availability, website changes, and analytics annotations before blaming the algorithm.
4. When Performance Becomes Erratic
Sometimes the issue isn’t one campaign. It’s an account instability. Results swing because the account structure is bloated, conversion actions are mixed, or the bidding strategy is learning from inconsistent signals. Fix the structural problems before chasing tactical fixes.
How to Actually Fix Google Ads

Once you know where the account is leaking or stalling, improvement usually comes from four levers: bidding, creative, audience targeting, and landing page experience. The mistake most teams make is pulling all of them at once. Pick the lever that matches the diagnosis.
1. Bidding and Budget Control
Google Ads runs on an auction. Advertisers bid on keywords, and placement is determined by Ad Rank, which factors in your bid, ad relevance, expected CTR, and landing page experience. Bid amount alone doesn’t win the auction.
Top ad positions on the search results page generally deliver stronger CTR and conversion rates than lower placements, and automated strategies like Target ROAS can improve revenue efficiency once your account has sufficient conversion data.
That doesn’t mean every campaign should chase visibility blindly. It means your best-performing queries shouldn’t be starved by cautious bidding.
Practical moves:
- Raise ambition on proven campaigns: If a campaign has strong purchase quality, let Target ROAS compete harder where intent is highest.
- Separate brand from non-brand: They behave differently and shouldn’t train the same bidding logic.
- Protect budget for winners: Don’t let exploratory campaigns drain spend from product lines that already convert profitably.
2. Creative and Ad Copy
When you advertise on Google, your text ads appear as Google sponsored results competing alongside organic search results and shopping ads on the same page. Search ads qualify intent. The copy should help the right shopper click, and the wrong shopper pass.
Lead with the product truth: brand, category, price framing, shipping angle, or differentiator. Align copy with query intent. Ad relevance is enhanced by including primary keywords in headlines and utilizing Responsive Search Ads to test combinations.
Continuous A/B testing on ads and landing pages helps identify effective elements for driving sales or leads. Even small copy changes, like leading with price versus leading with shipping speed, can shift click quality meaningfully.
3. Audiences and Targeting Refinement
This is where most efficiency wins sit. Move strong queries into tighter match structures and exclude repeated low-fit themes. Use customer lists to support retention or suppress existing buyers when the goal is new customer acquisition. Control geographic waste: multi-market brands often spend in locations they can technically target but can’t profitably serve.
4. Landing Pages and Conversion Rate Work
Many accounts hit a ceiling because the ads are better than the pages. Paid search can only scale as far as the post-click experience allows.
Match the message immediately: the product, offer, and value proposition in the ad should be front and center on the page. Make shipping, returns, delivery timing, reviews, and payment options easy to find. Build pages for intent, not internal org structure. High-intent product searches often need a tighter destination than a generic category page.
The ad wins the click. The landing page wins the order.
If your landing pages are consistently underperforming paid traffic, the conversion rate optimization tools your team is using may need a rethink, too.
Final Thoughts: From Numbers to Revenue Decisions
Good Google Ads results don’t come from staring harder at dashboards. They come from running a disciplined feedback loop.
Measure cleanly. Read performance in context. Diagnose the bottleneck. Pull the right lever. Then, validate the outcome against revenue, margin, and customer quality. That cycle is what turns Google Ads from a noisy ad platform into a dependable growth system for a D2C brand.
Stop asking whether a campaign is good or bad in the abstract. Ask what the numbers are telling you to do next. Should you cut wasted queries, bid more aggressively on proven intent, rewrite ad copy to qualify traffic better, or improve performance on the page that’s leaking conversions after the click? The account improves faster when every metric leads to an action.
Mastering Google Ads results is a business skill, not a reporting skill. Brands that build this discipline make better budget decisions, protect margin more effectively, and grow with fewer surprises.
If your team wants help turning ad platform data into revenue decisions, Aureate Labs works with D2C and B2C eCommerce brands across paid media, tracking, CRO, and storefront performance so your Google Ads efforts connect to actual business growth, not just better-looking dashboards.
Resources:


Post a Comment
Got a question? Have a feedback? Please feel free to leave your ideas, opinions, and questions in the comments section of our post! ❤️